In a chart analysis shared via X, the crypto analyst Dark Defender provided insight into the potential price movements of XRP ahead of this week’s Ripple-SEC case update. The analysis, conducted on a monthly time frame, reveals that XRP has been holding above a critical support trend marked in blue. With the crypto community’s eyes set on the new Ripple filings expected next week, there’s a mix of anticipation and caution.
XRP Price Enters Potentially Crucial Week
Dark Defender notes that although market news does not typically have a direct correlation with price movements, the “last puzzle piece” pertaining to the Ripple case may add a layer of enthusiasm to the market sentiment surrounding XRP. The question posed is: What could happen if XRP fails to maintain its position above the blue support line?
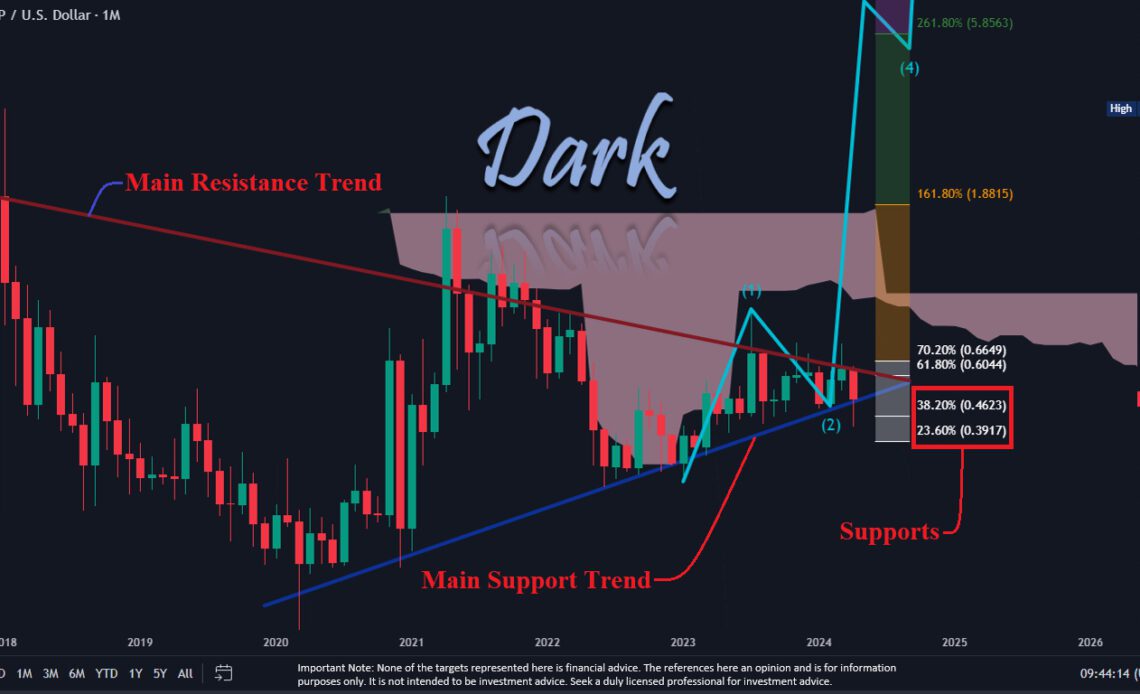
According to the analysis, if XRP breaks below this blue support line, it will likely approach the two critical Fibonacci retracement levels at $0.4623 (38.2% retracement level) and $0.3917 (23.6% retracement level). These figures are derived from the swing high and low points on the chart, traditionally considered potential support levels where the price could stabilize or bounce back.
In the context of the current chart, a drop below these levels, particularly if the price closes under $0.3917 for two to three days consecutively, would invalidate the bullish five-wave structure that Dark Defender suggests could propel XRP to a high of $5.85. On the flip side, should XRP reclaim the 61.8% Fibonacci level at $0.6044, it could signify a first step towards a strong upward move.
Between the price range of $0.6649 and $0.3917, any price movement is considered a sideways trend. A breakout above the 70.2% level at $0.6649 would likely confirm a bullish trend, with the analyst highlighting this as a significant threshold for a positive price trajectory. Above this level, XRP would then eye the next Fibonacci extension levels of $1.8815 (161.8% extension) and potentially $5.8563 (261.8% extension), which are ambitiously projected targets.
The chart also highlights a “Main Resistance Trend” line that has capped the price since the peak of early 2018, and the current price action is pinched between this descending resistance and the ascending support trend lines, forming a converging pattern that traders often interpret as a potential breakout signal.
A breakout could be the…
Click Here to Read the Full Original Article at NewsBTC…


