The Cardano (ADA) price is down 46% since its yearly high and is currently facing a make-or-break price level for a bullish reversal. Here’s what you need to know:
Cardano Price Analysis: Daily Chart
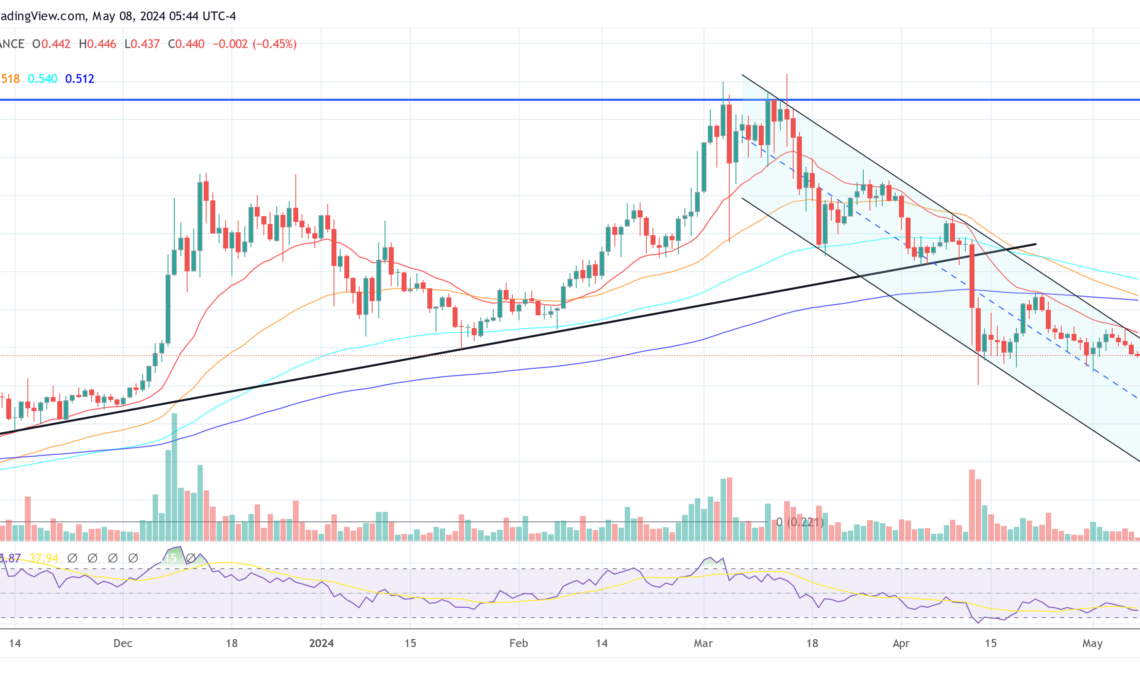
The daily ADA/USD chart is currently charting a path within a descending channel, which has defined the bearish trend since the beginning of March. On Monday, the ADA price peaked near $0.475, encountering substantial resistance at the channel’s upper boundary and from the critical 20-day Exponential Moving Average (EMA), which stands currently at $0.47.
In the short-term, this resistance level is crucial as it coincides with historical price rejection points, confirming its significance. As of press time, ADA is trading at approximately $0.44.
The convergence of the 20-day EMA ($0.47), 50-day EMA ($0.54), and 100-day EMA ($0.51) above the current price level illustrates a dense zone of resistance. The 200-day EMA at $0.52 reinforces this barrier, emphasizing a strong bearish momentum.
The Relative Strength Index (RSI) on the daily chart is currently at 38, which does not venture into the oversold territory (below 30) but indicates a bearish momentum with potential for further decline unless a reversal occurs.
For a bullish reversal, ADA needs a sustained break above the $0.47 mark (20-day EMA) with accompanying high volume to confirm the breakout from the descending channel and shift the market sentiment. Then, the cluster of EMAs becomes the central resistance zone.
Crossing this band is of utmost importance in order to build up bullish momentum for a break above the yearly high of $0.81 from March. If not, the ADA price could trend towards the midline of the channel and drop below $0.40.
In-Depth Weekly Chart Overview
Transitioning to the weekly chart, the broader picture also underscores the bearish sentiment that has dominated ADA since it reached its peak at $3.17 in late 2021. The series of lower highs and lower lows is a textbook representation of a downtrend.
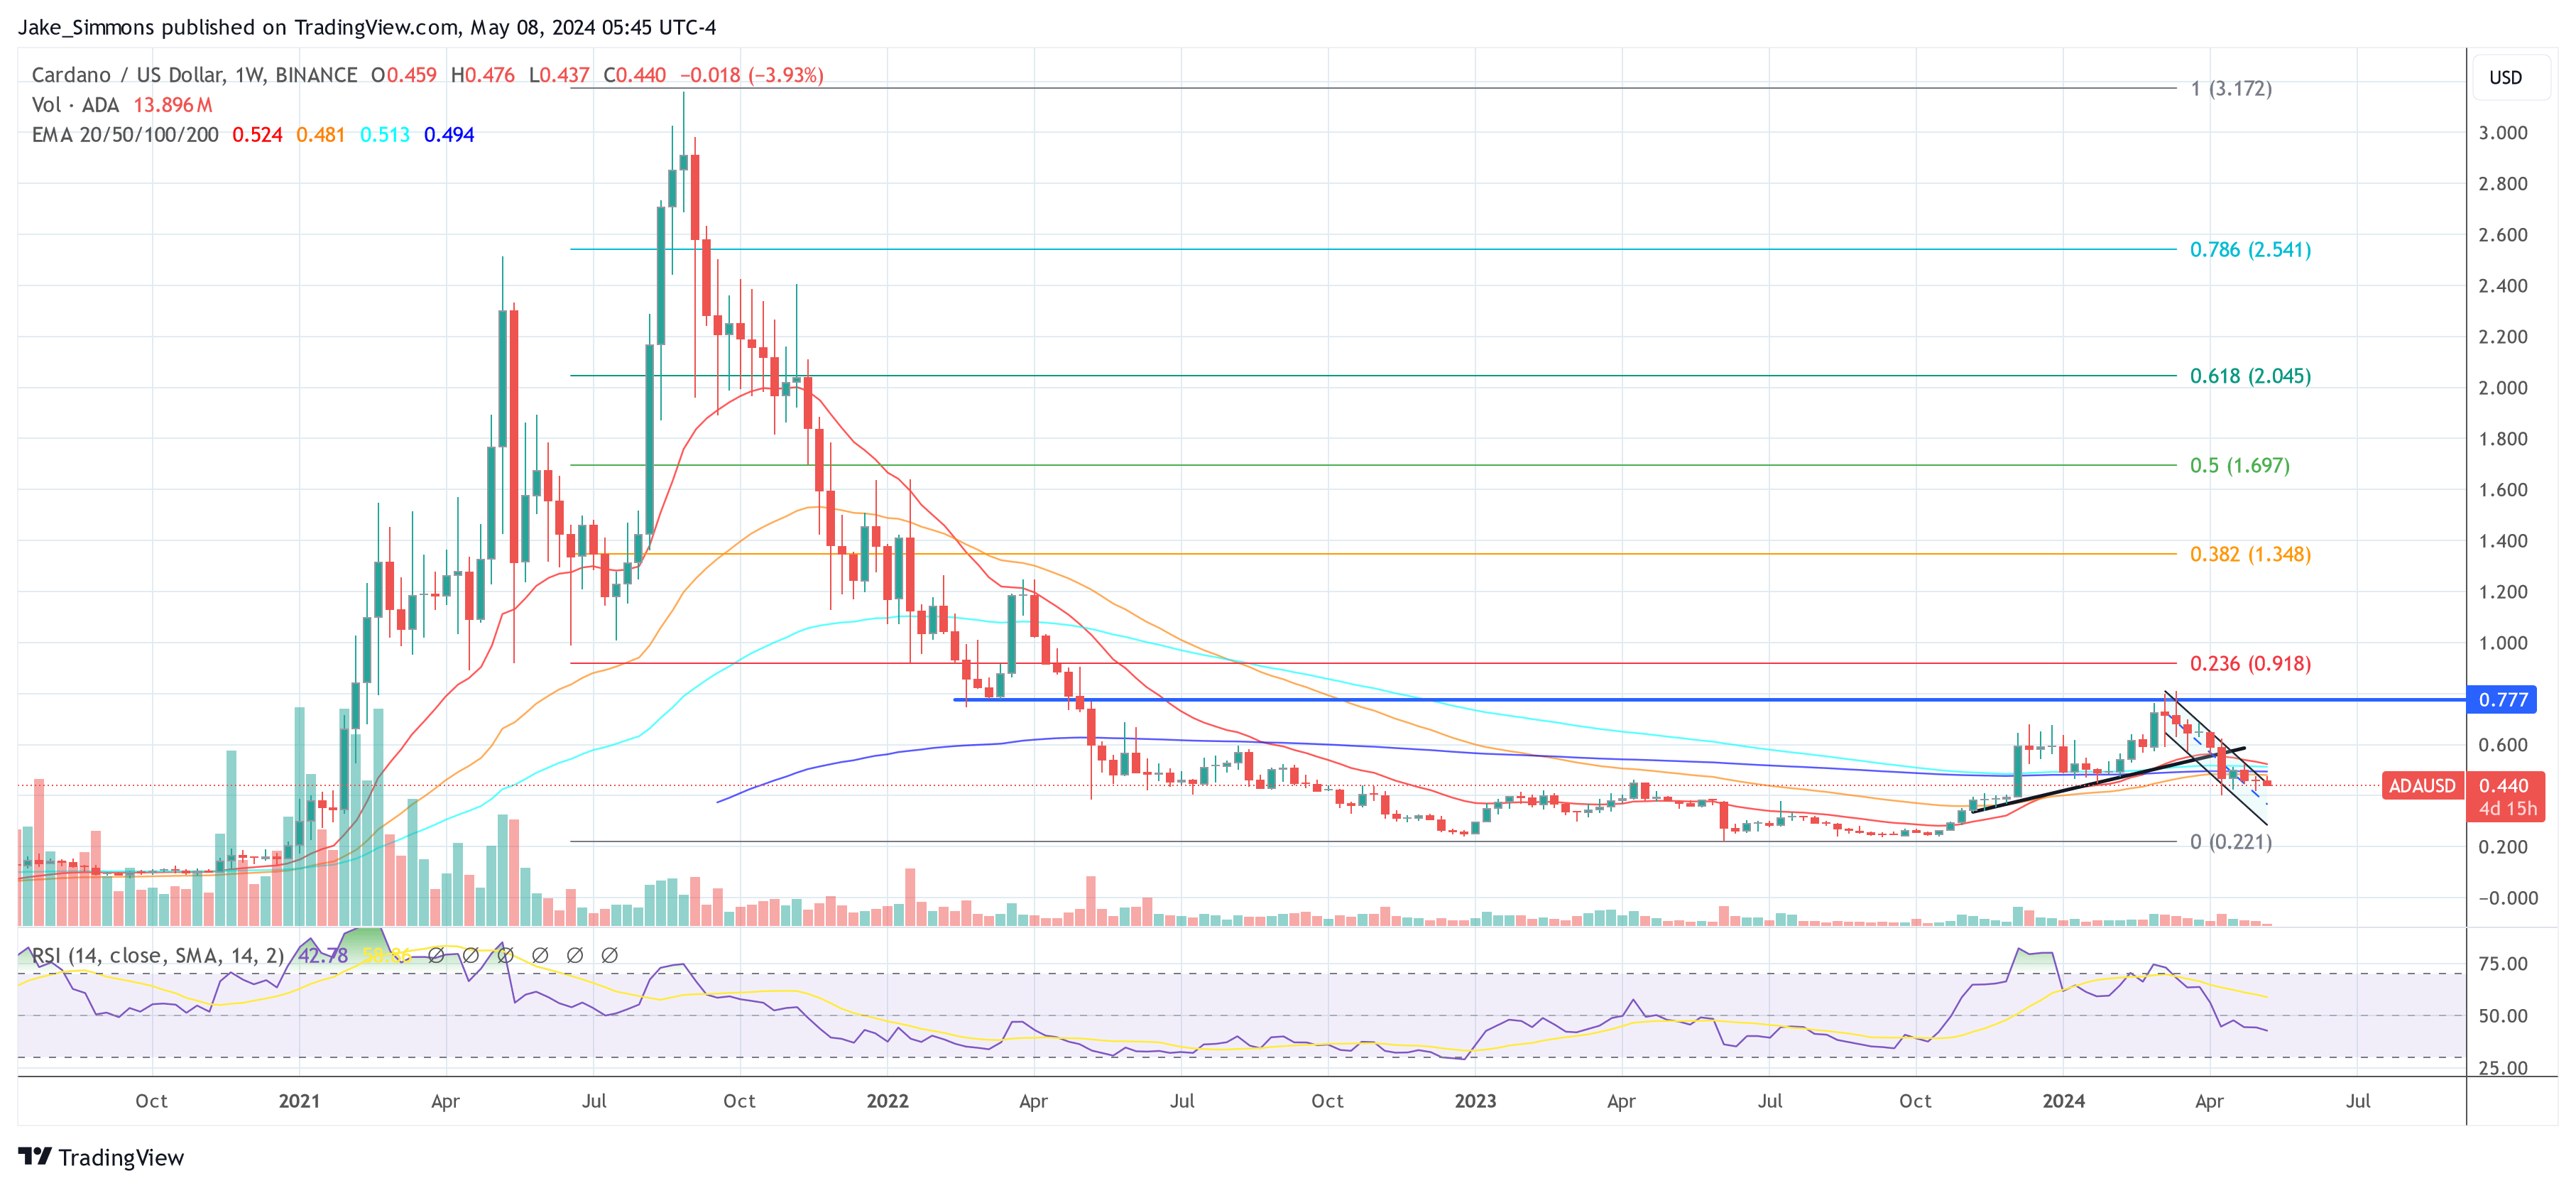
The price action currently remains suppressed below the long-term moving averages: the 20-week EMA at $0.52, 50-week EMA at $0.48, 100-week EMA at $0.51, and 200-week EMA at $0.52, all of which slope downwards, underscoring the persistent selling pressure in recent weeks.
The Fibonacci retracement levels, drawn from the high of $3.17 to the…
Click Here to Read the Full Original Article at NewsBTC…


