The events of the past week have led to significant sell pressure across the crypto market. Since FTX insolvency rumors broke on Nov. 6, peak outflows saw $270 billion leave the market.
Despite the bearish market conditions, on-chain data analyzed by CryptoSlate showed all Bitcoin cohorts have flipped into accumulation mode, with whales buying most aggressively.
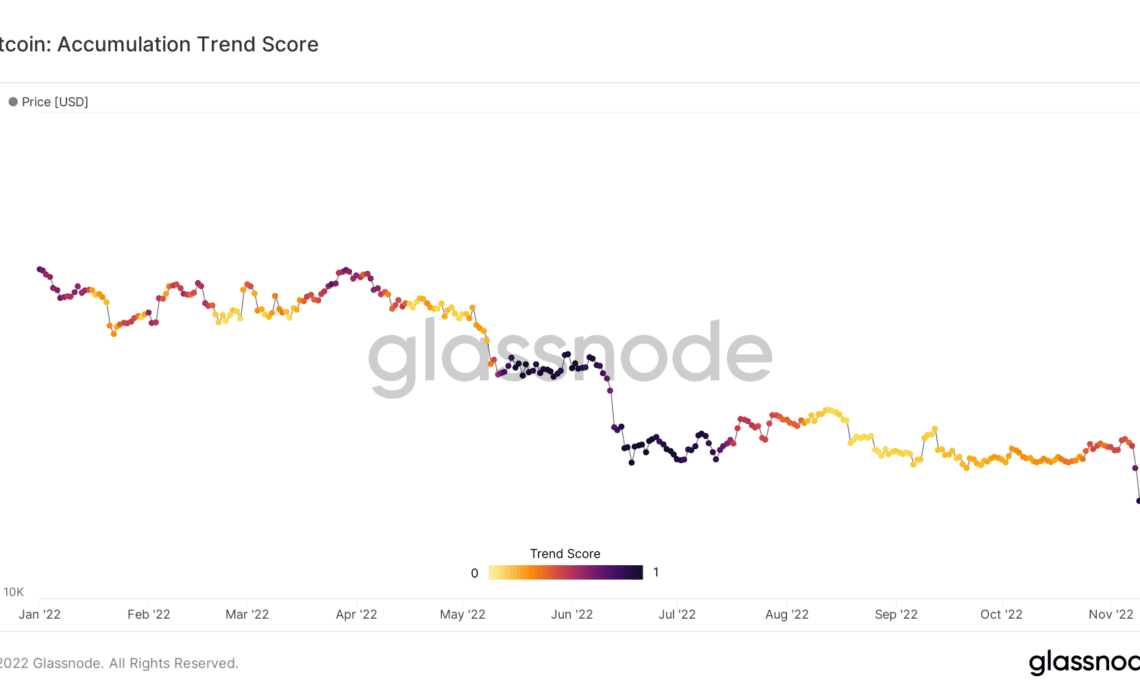
Bitcoin Accumulation Trend Score
The Accumulation Trend Score (ATS) looks at the relative size of entities that are actively accumulating, or distributing, in relation to their Bitcoin holdings.
The ATS operates on a scale of 0 to 1. A reading close to 0 indicates distribution or selling. Whereas a reading close to 1 indicates accumulation or buying.
The chart below shows whales accumulated for the first time since August. The current reading comes in at 0.97, indicating an aggressive rate of accumulation and the highest since 2019. For comparison, the previous day’s ATS reading flashed 0.74.
Despite jitters resulting from the collapse of FTX, the market sees value in Bitcoin priced in the teens.
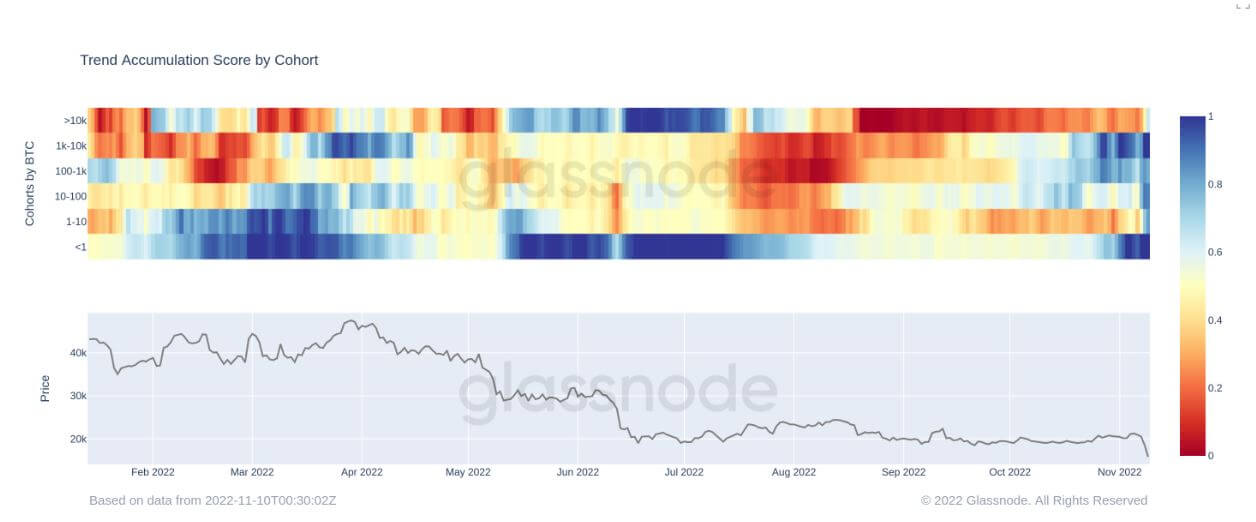
Cohort analysis
Entities holding between 1,000 and 9,999 Bitcoin are categorized as whales. While 10,000+ BTC holdings refer to super whale status.
In recent days, all cohorts have flashed light blue or darker blue, indicating all cohorts are accumulating in unison — an unprecedented pattern in 2022.
Whales and minnows — entities holding less than 1 BTC — in particular are the cohorts accumulating most aggressively.
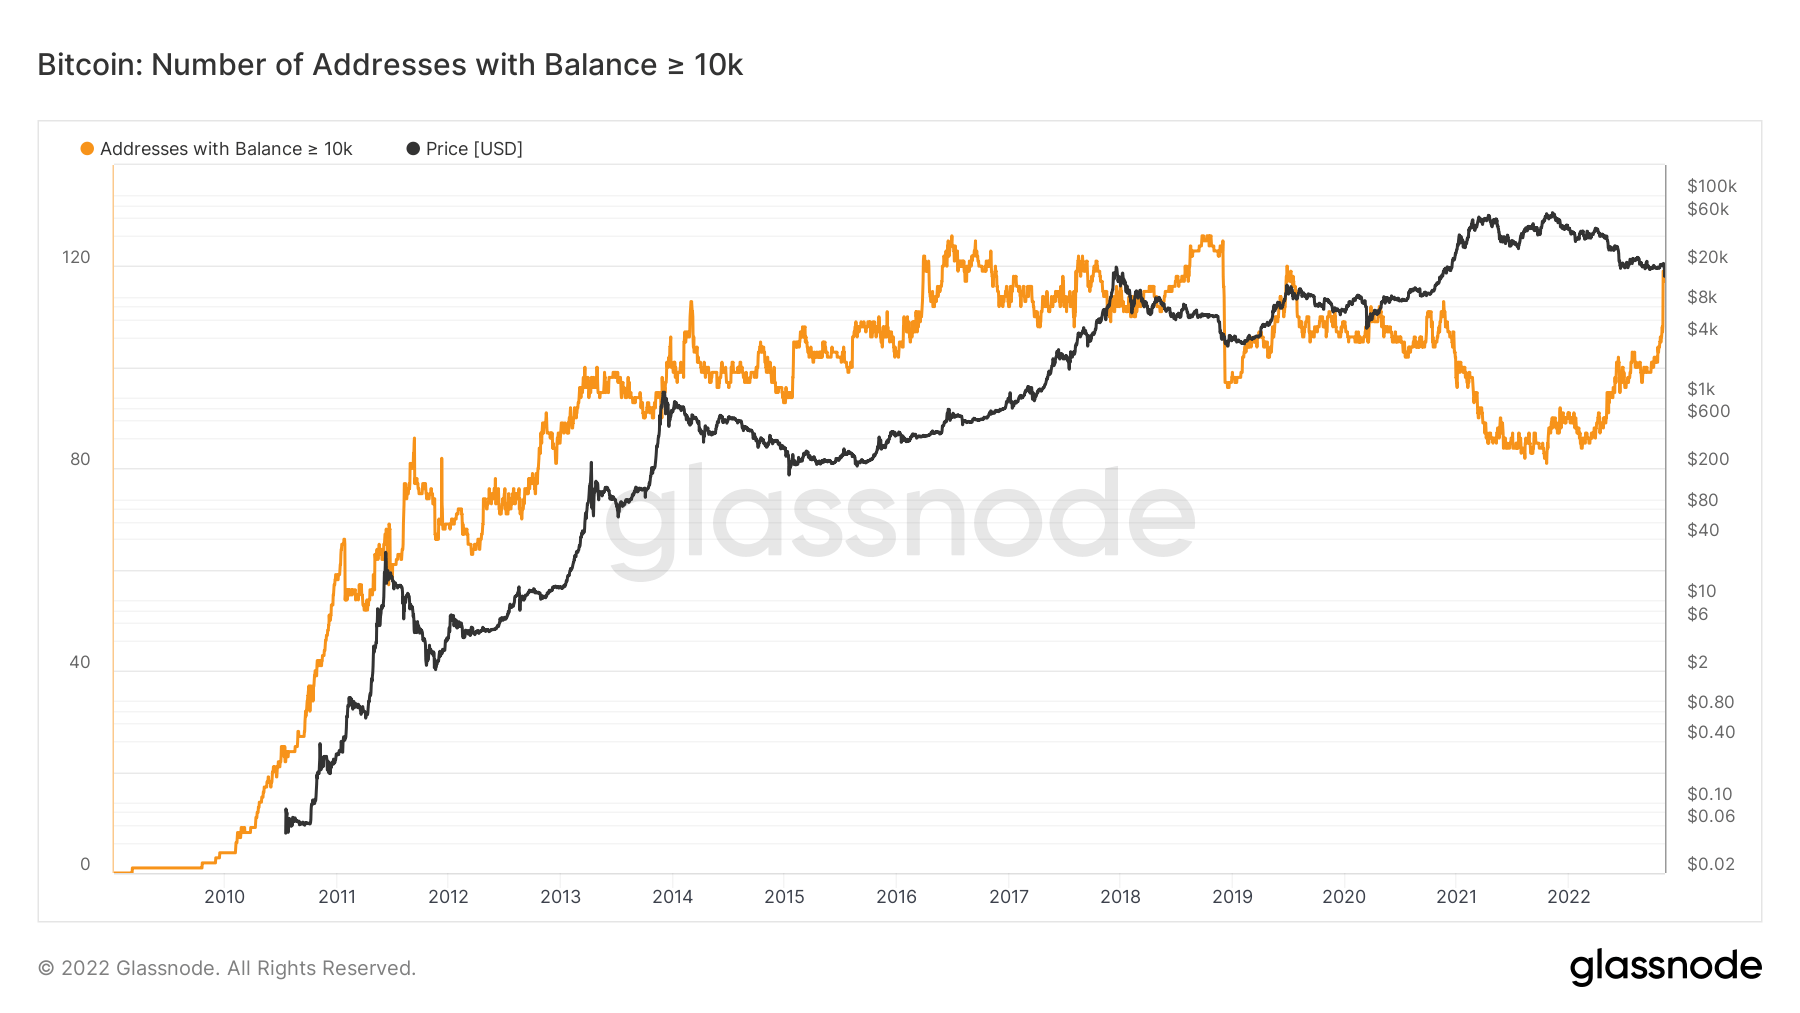
On-chain data shows the number of addresses (up to whale status,) bottomed at approximately the time of the $69,000 market top. Since then, an uptrend over 2022 has culminated in a sharp uptick in recent days.
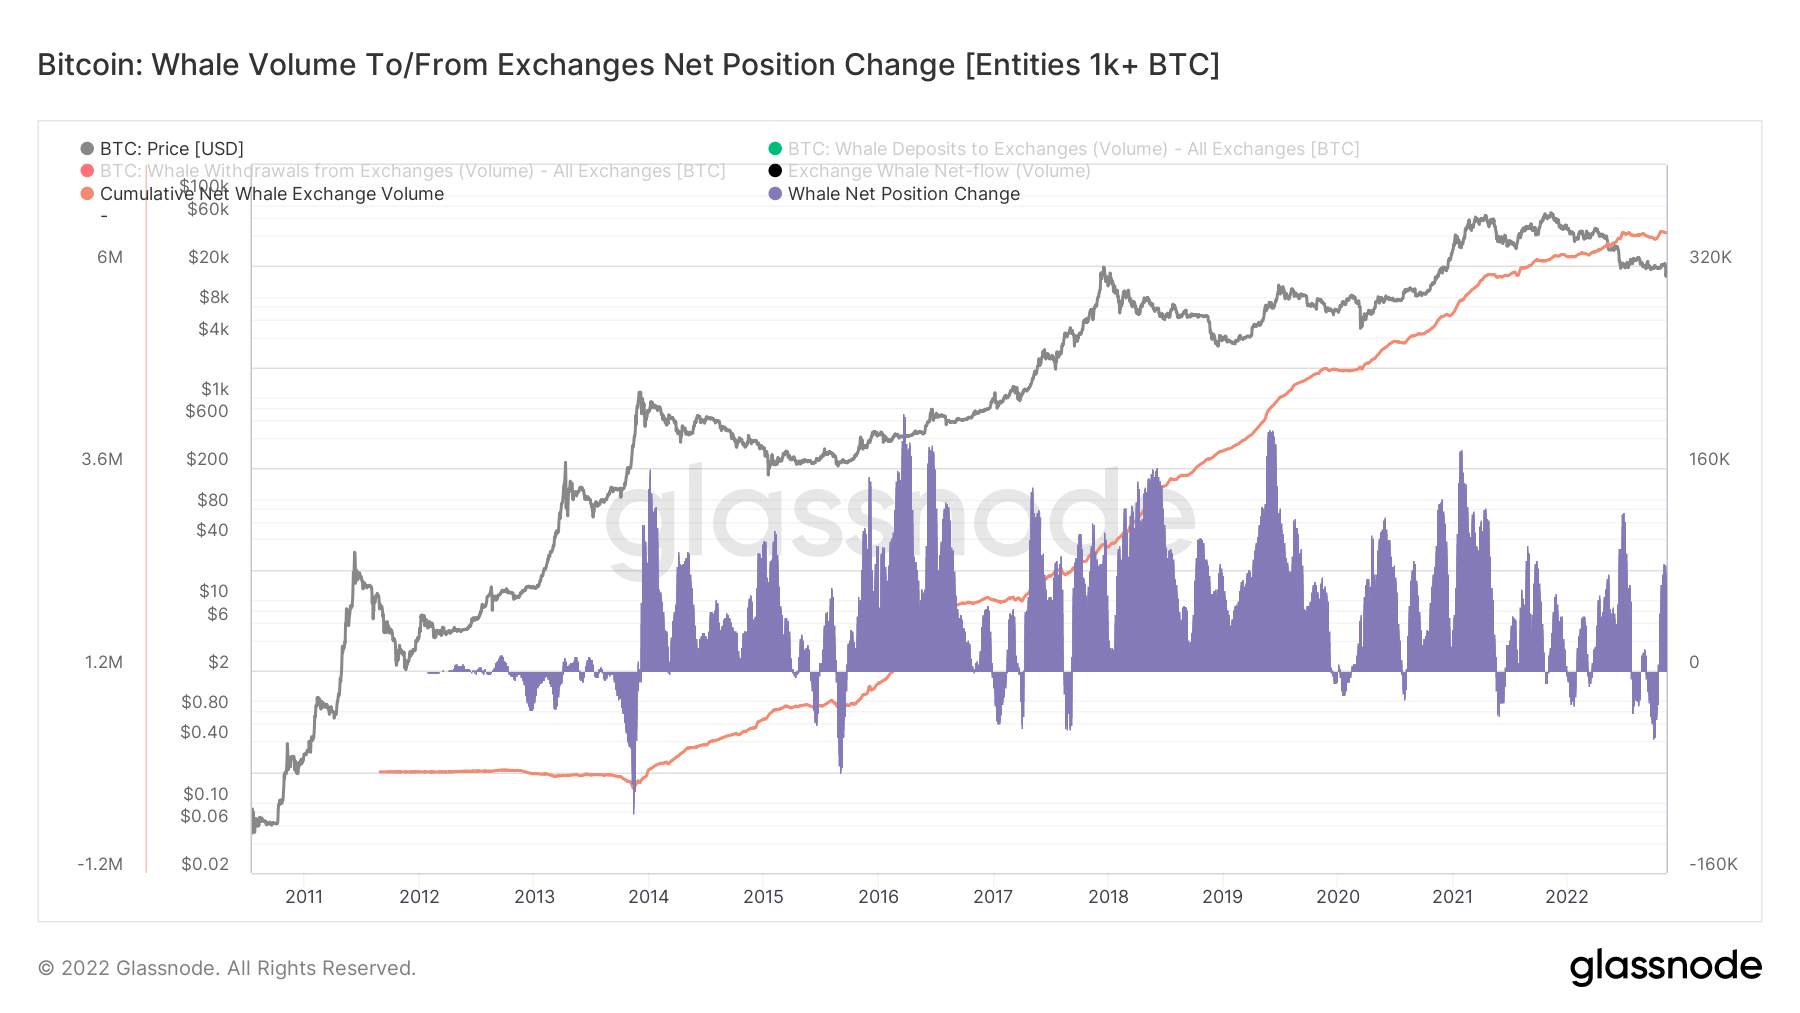
Whale Exchange Net Position Change
Exchange Net Position Change shows the 30-day change in the Bitcoin supply from exchange wallets. Readings above 0 indicate inflows into exchange wallets, while below 0 show BTC leaving exchange wallets.
The chart below shows this data for whales and super whales. Recent days show exchange whale and super whale holdings have spiked higher. The last time this happened, to a comparable degree of significance, was during August.
Although the primary reason entities send tokens to exchanges is to cash out. The Cumulative Net Whale Exchange Volume shows a macro increase over time, indicating this is not the case for whale holders.
Click Here to Read the Full Original Article at Bitcoin (BTC) News | CryptoSlate…


