In a technical analysis, crypto analyst Dark Defender has provided a bullish perspective on the XRP price action, indicating that the cryptocurrency is on the cusp of a potential breakout. The analysis presented is based on a daily chart that encapsulates several advanced technical indicators and theories.
Why A XRP Price Breakout Is Imminent
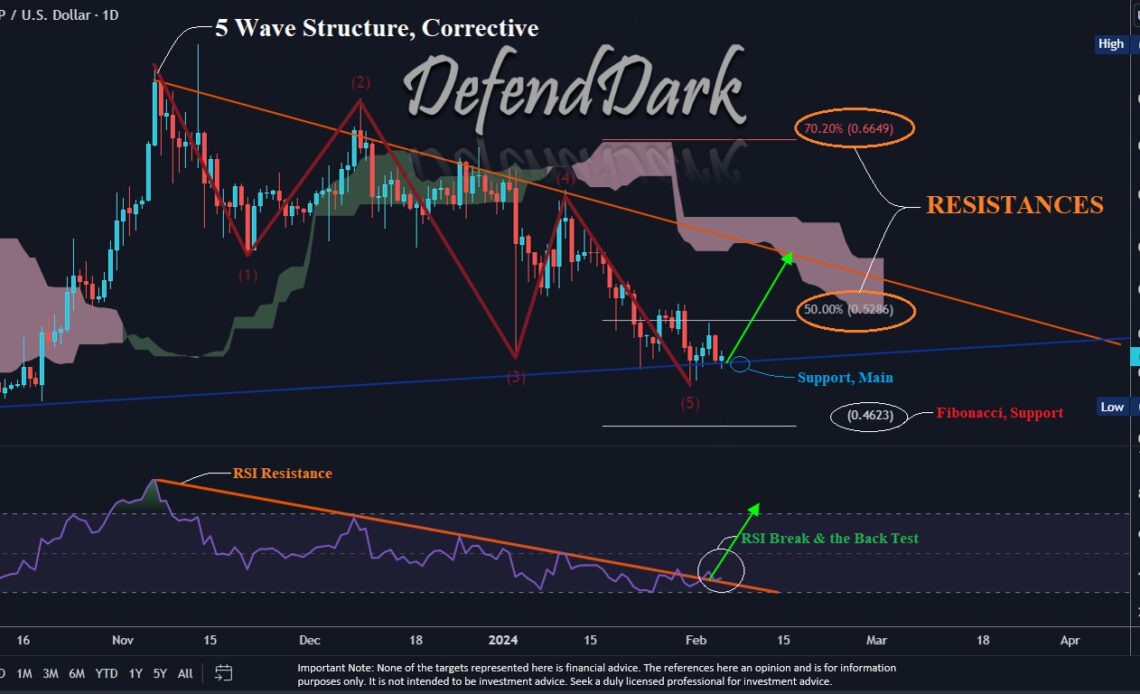
The core of Dark Defender’s analysis is the completion of a five-wave corrective structure, as posited by Elliott Wave Theory. This theory suggests that markets move in repetitive cycles, with the five-wave pattern indicating a correction following a larger trend.
In XRP’s case, the waves numbered (1) to (5) illustrate a complete correction within a larger bullish context. The implication is that the completion of this pattern could lead to the start of an impulsive, upward wave sequence.
Dark Defender points to the critical support level at $0.4623, a value derived from Fibonacci retracement analysis. Fibonacci retracements are based on the idea that markets will retrace a predictable portion of a move, after which they will continue to move in the original direction. The $0.4623 level appears to be a strong area of buyer interest, representing a potential reversal zone.
On the resistance side, two levels are highlighted. The first is set at $0.5286, which is the 50% retracement level from the previous high. This price point acts as an interim hurdle for XRP’s price, serving as a barometer for short-term sentiment. A more significant resistance is noted at the 70.2% Fibonacci level of $0.6649. A break above this level could be a strong indication of bullish momentum and may attract further buying interest.
The chart also incorporates the Ichimoku Cloud, which is currently acting as dynamic resistance. The Ichimoku Cloud is a multifaceted indicator that provides information on support and resistance, trend direction, momentum, and buy or sell signals. A decisive breakout above the cloud would suggest a change in trend favoring the bulls.
Remarkably, the Ichimoku Cloud aligns with a descending trend line (red line). A break above both indicators could spell strong bullish momentum.
Another compelling aspect of the analysis is the RSI breakout and subsequent retest. The RSI is a momentum oscillator used to identify overbought or oversold conditions. In XRP’s case, the RSI had previously been in a downtrend, indicating persistent…
Click Here to Read the Full Original Article at NewsBTC…


