Wyckoff Analysis (WA) aims to understand why prices of stocks and other market items move due to supply and demand dynamics. It typically is applied to any freely traded market where larger or institutional traders operate (commodities, bonds, currencies, etc.). In this article we will apply WA to the cryptocurrency Cosmos ($ATOM) to make a forecast for approximate future events.
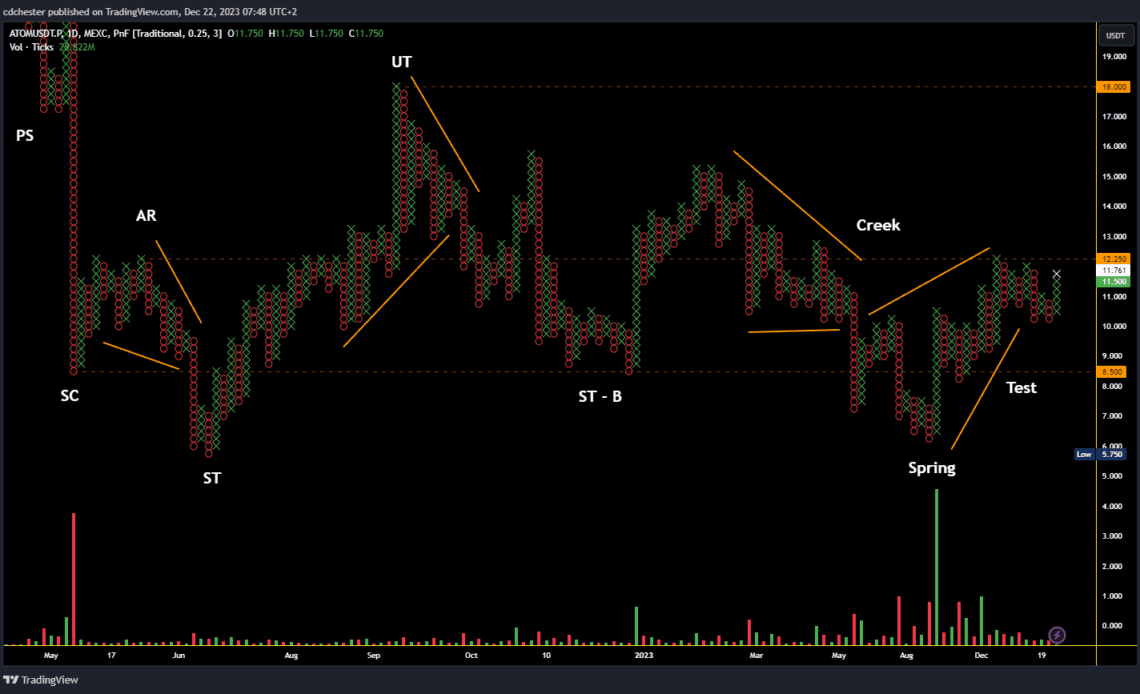
Cosmos Price Data from MEXC Futures | Source: ATOMUSDT.P on tradingview.com.
Link to the raw image: https://www.tradingview.com/x/r8asKWOI
Cosmos $ATOM is currently in Phase D of a Wyckoff Accumulation Schematic #1. Note the volume spike near where I placed the SC and Spring. In Wyckoff Analysis these typically must align even if the overall form isn’t perfect. The only slight anomaly is that the ST dips sharply below the SC breaking the ICE (not labeled). There are Advanced Schematics that you can find online that accommodate many of these anomalous formations.
Phase D is where demand greatly overcomes supply leading the rallies on higher (or noticeably increasing) volume. When an LPS occurs that is typically a favorable (even optimal) place for a long position. It recently finished a Reaccumulation, to which it’s rallying sharply. Below are the typical schematics for both Wyckoff Accumulation Schematic #1 and a Reaccumulation for reference.
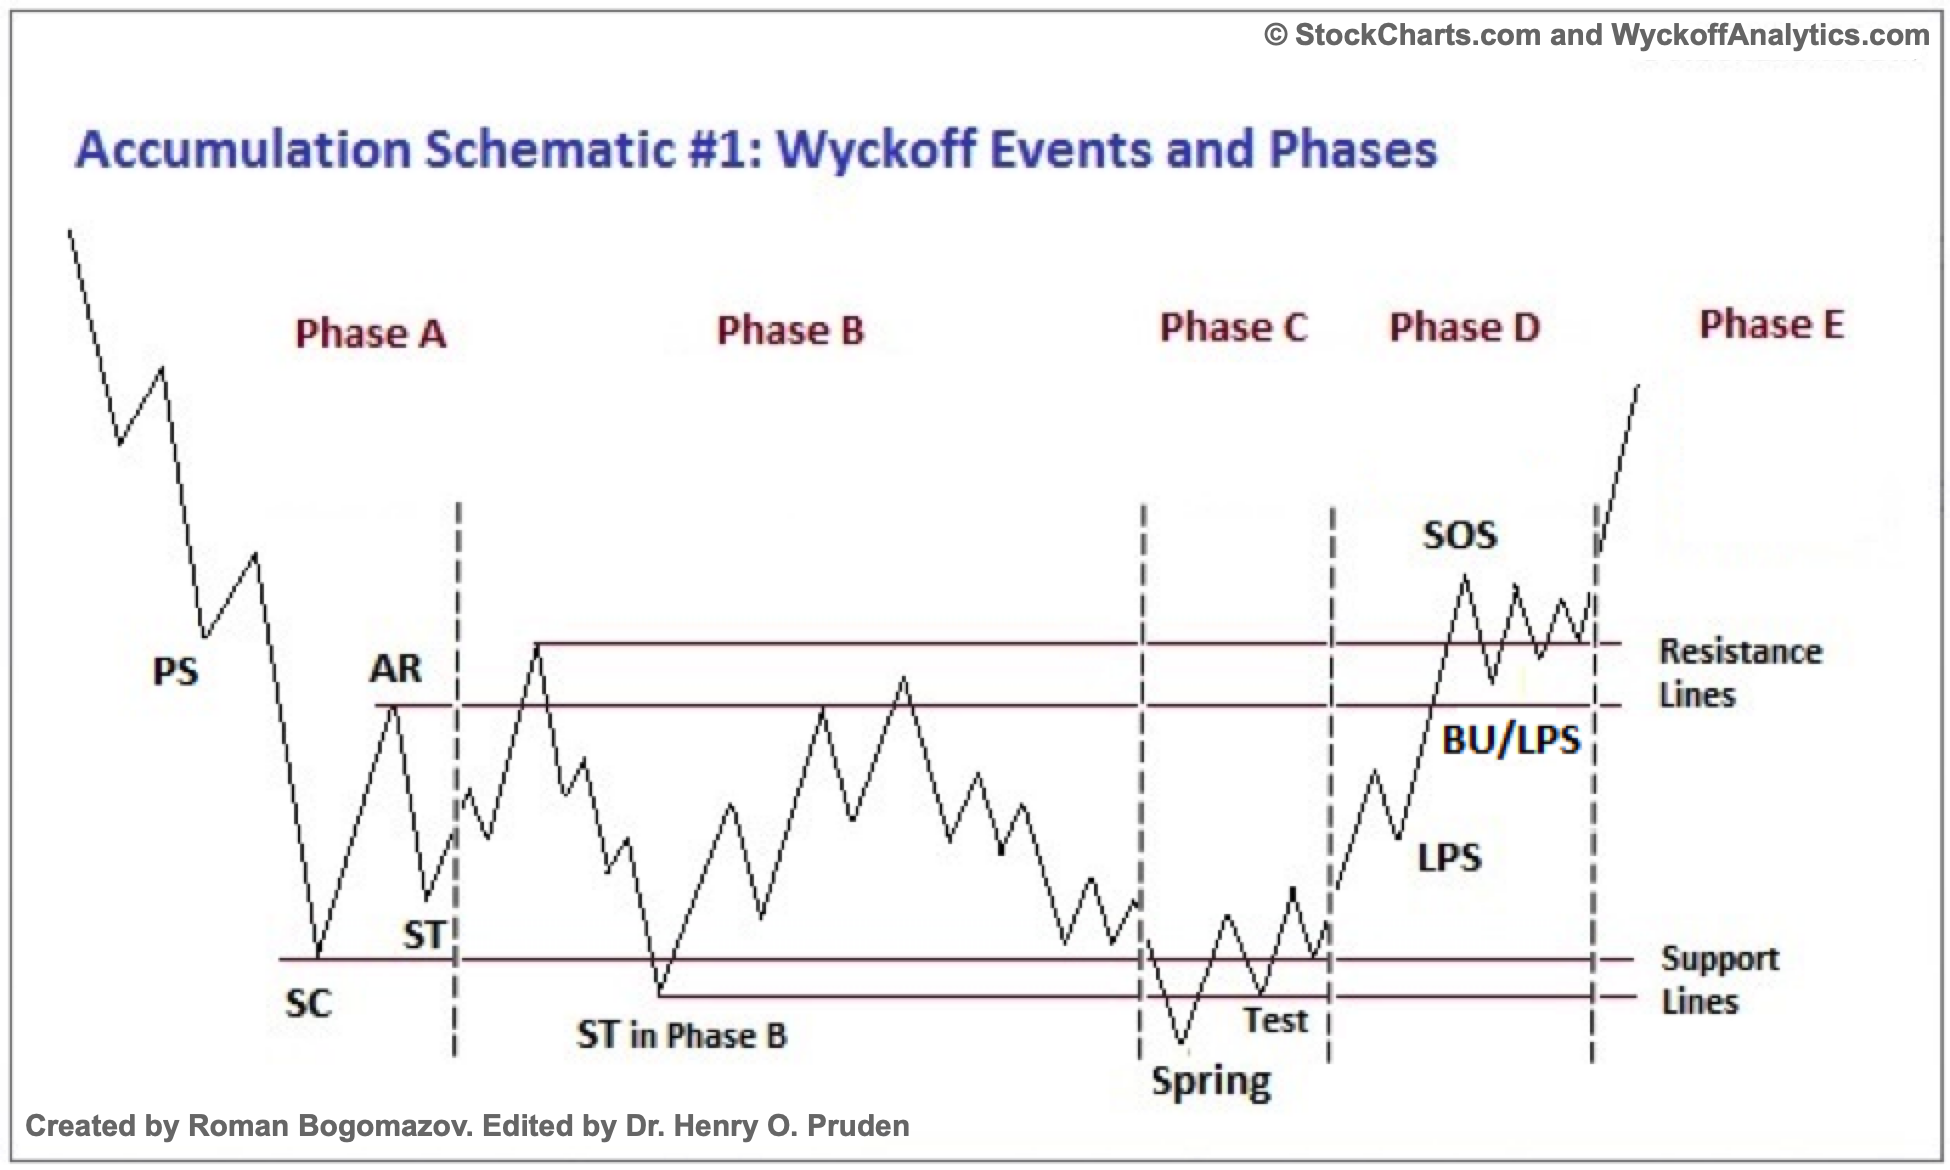
Wyckoff Accumulation Schematic #1 | Source: StockCharts.com
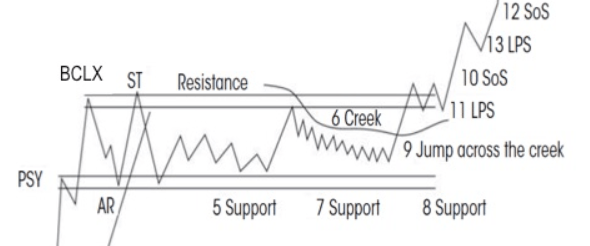
Wyckoff Reaccumulation Schematic | Source: StockCharts.com
Cosmos Price Targets
The basic target (per the schematic) is the top of the trading range. In this case it’s at $18, but $15 is a preliminary target it must concretely clear first. Doing some more work using the Horizontal Count method with PnF charts yields different results. My settings are currently a $0.25 box size and a three box reversal on a High-Low lookback.
When using the Horizontal Count method Extended Congestions need to be accounted for differently. The main thing is finding the relevant column in and out to create the Congestion Box. In our case that’s from 13 to 20 December 2023 spanning 7 bars. Since this is a Reaccumulation “breakout” we will need to add the value from the formula the Horizontal Count uses.
7 x $0.25 x 3 = $5.25
The relevant low to add this to is $10.25 so the PnF target is $15.5.
Glossary
All quotes are from the first link in Supplemental Reading.
Preliminary Support (PS) – “where substantial buying begins to provide pronounced…
Click Here to Read the Full Original Article at NewsBTC…


