
Bitcoin clawed its way over $27,000 on Sep. 18 after struggling to reclaim its tight summer trading range for most of the month. Although every price uptick brings a breath of optimism to the industry, on-chain data still suggests a dominant sell-side regime on the market.
Buy-side and sell-side exchange inflows are critical in shedding light on this market sentiment. These inflows offer a tangible way to gauge capital shifts based on preferences concerning exchange volumes.
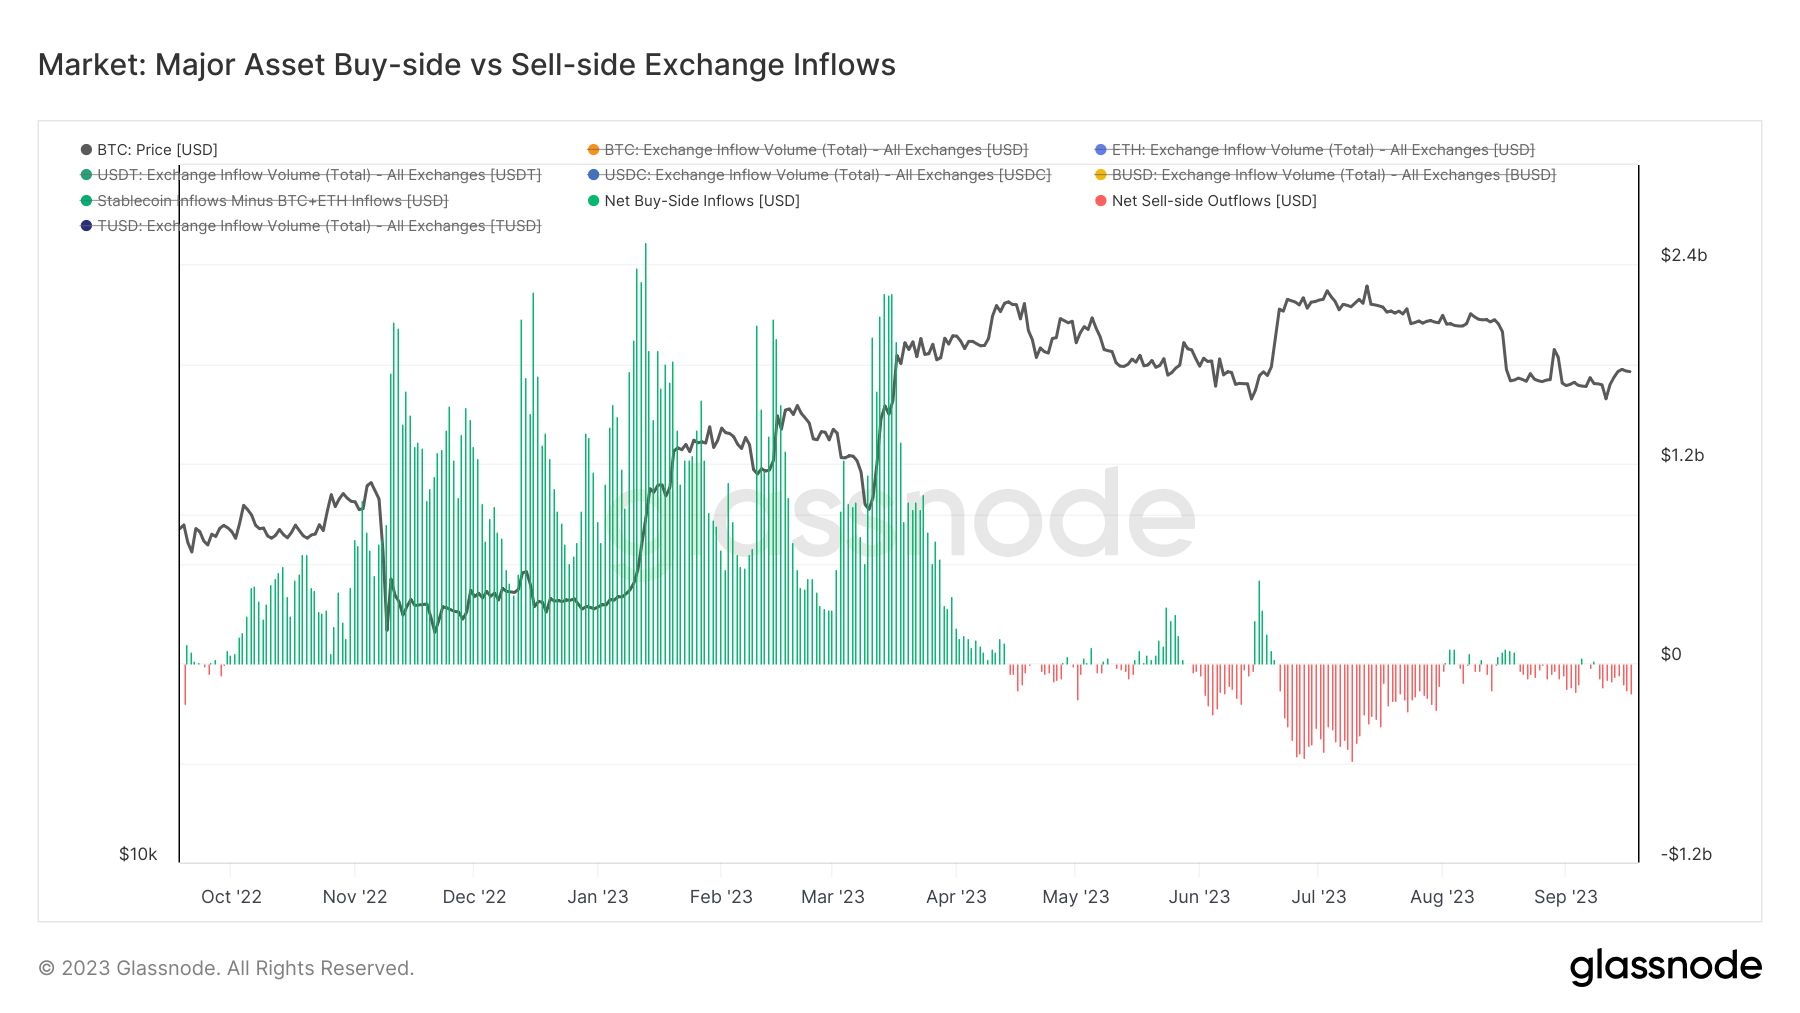
Specifically, the assumption lies in treating Bitcoin (BTC) and Ethereum (ETH) inflows, when denominated in USD, as indicative of sell-side pressure. Conversely, inflows of stablecoins are seen as representative of buy-side pressure.
The metric offsets the BTC/ETH sell-side volumes against stablecoin buy-side volumes, giving an overarching view of exchange inflows. Essentially, values hovering around zero suggest a market equilibrium. Positive values signify a buy-side dominance, while negative ones point to a sell-side dominance.
However, it’s important to note that this metric is based on the premise that BTC and ETH are deposited to exchanges to be sold, and stablecoins are deposited to exchanges to buy other major assets. Both stablecoins and other digital assets can flow into exchanges for myriad reasons, not limited to trade. These include custody considerations, collateral purposes, or maintaining position margins. Therefore, it’s more important to analyze shift changes than nominal amounts of outflows.
A heightened sell-pressure began last week, casting a shadow over Bitcoin’s ascension to $27,000. This means that market participants seem to be cashing out their positions despite the uptick in price.
A wider lens reveals a noticeable pivot from buy-side to sell-side began unfolding in April. After a tumultuous three months of quick regime shifts, the market sank into a sell-side dominance by mid-July, a trend that lasted till August.
The market-realized value net capital change (MRVNCC) is another valuable metric for gauging capital inflows. It shows the aggregate 30-day net position change for the largest assets in the market, essentially representing the market’s financial health.
The MRVNCC considers the realized cap of major…
Click Here to Read the Full Original Article at Bitcoin (BTC) News | CryptoSlate…


