Shiba Inu (SHIB) price is once again at a crucial crossroads. Currently, it’s down a staggering 91% from its all-time high (ATH) of $0.00008845, recorded in October 2021. Over the past year, the token has been on a consistent downtrend, marking lower highs and lower lows on the monthly time frame. But all is not bleak for SHIB investors.
The recent relaunch of Shibarium, a layer 2 blockchain, is a beacon of hope. This move is seen as Shiba Inu’s attempt to transition from its meme coin status to a more serious player in the crypto world, aiming to enable applications for millions across a vast ecosystem.
Shiba Inu Faces A Double-Edged Sword
From a technical chart analysis perspective, there’s another glimmer of hope: the formation of a triple bottom pattern. This pattern, if validated, could signal the end of SHIB’s two-year-long downtrend. However, it’s a double-edged sword. If invalidated, this pattern could morph into a descending triangle, potentially pushing SHIB to new lows.
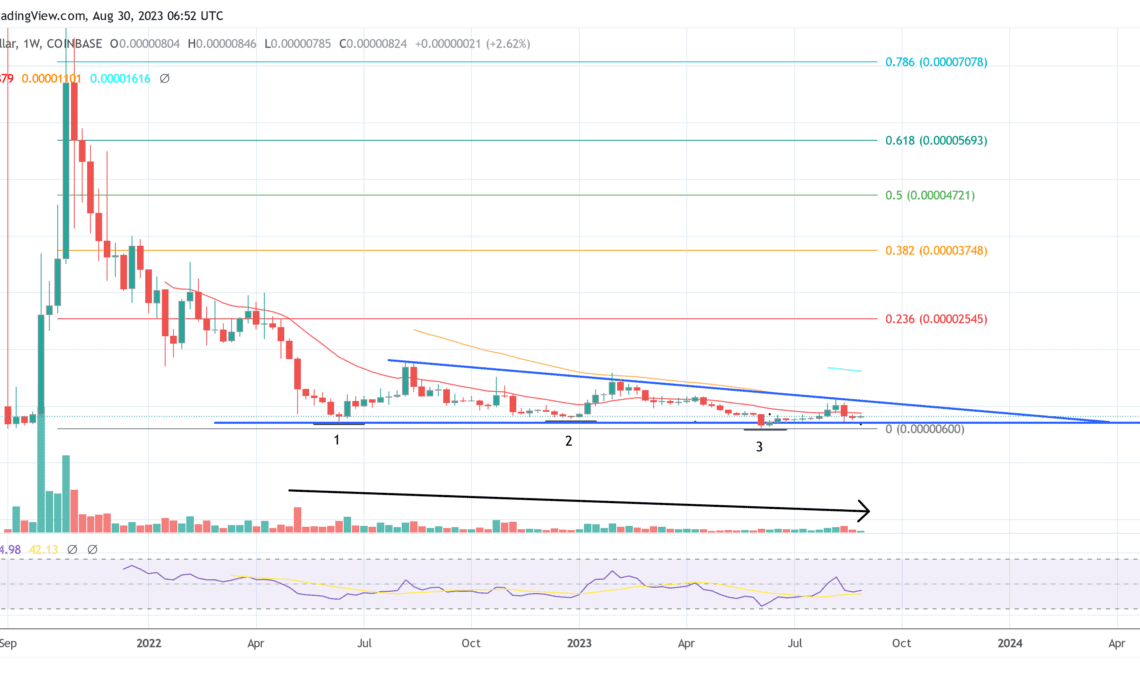
A closer look at SHIB’s weekly chart reveals the formation of this triple bottom pattern. A triple bottom is a bullish chart pattern. It’s characterized by three roughly equal lows bouncing off a support level, followed by a breakout above the resistance. This visual pattern indicates a shift in power from sellers (bears) to buyers (bulls).
Remarkably, the formation of a triple bottom is often seen as an opportunity for traders to enter a bullish position, especially after a prolonged bearish trend, as is the case with SHIB. A few rules typically qualify triple bottoms.
An existing downtrend should precede the pattern. SHIB checks this box. Second, the three lows should be roughly equal in price, allowing for a horizontal trendline. SHIB fits this criterion as well. Third, the volume should decrease throughout the pattern, indicating weakening bears, while bullish volume should surge as the price breaks through the final resistance. The chart highlights this for SHIB.
To delve deeper into the specifics: SHIB’s first bottom was recorded when it dropped to the $0.00000715 mark in June 2022. A subsequent recovery was short-lived, causing SHIB to fall to its second bottom at $0.00000781 in December 2021. The third bottom was formed at $0.0000060 in June 2023, after another recovery attempt faced resistance and marked a lower high.
However, the…
Click Here to Read the Full Original Article at NewsBTC…


