An analyst has revealed the four key Bitcoin price levels that could be to keep an eye on, as they may have an influence on the spot price’s trajectory.
These Are The Four Key Price Points For Bitcoin
In a new post on X, CryptoQuant Netherlands community manager Maartunn has shared four key price levels for Bitcoin. Three of these levels involve some kind of variation of the “realized price” on-chain indicator.
The realized price keeps track of the price at which the average investor on the network acquired their coins. In other words, the metric measures the average cost basis of the asset’s user base.
When the spot price of the cryptocurrency is greater than the realized price, it means that the average holder in the sector can be assumed to be carrying some profits right now. On the other hand, the price being under the indicator implies the market as a whole is underwater some net amount at the moment.
Naturally, the price is exactly equal to the metric, suggesting the average holder is just breaking even on their investment currently. Historically, this is the condition that has been of particular importance for the coin, as such retests can flip the profit-loss situation of the investors.
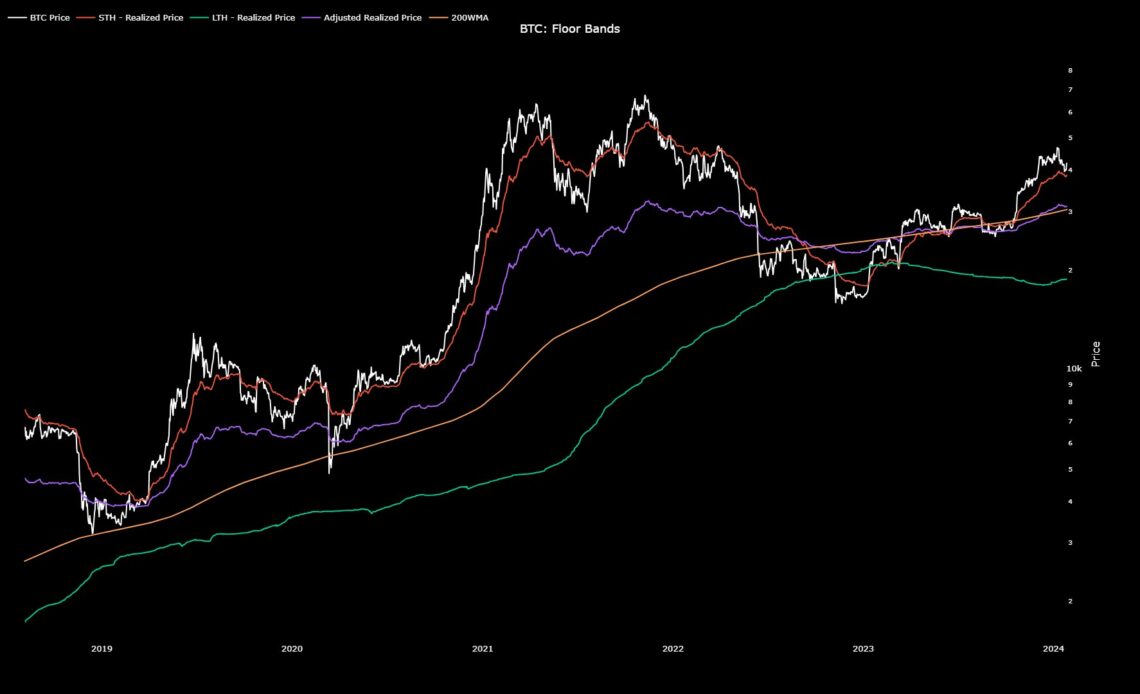
Now, here is the chart shared by Maartunn that reveals the trend in the four key Bitcoin price points in question over the last few years:
The four historically relevant price levels for the cryptocurrency | Source: @JA_Maartun on X
In the above graph, the red colored line (which also happens to have the highest value out of these right now) corresponds to the realized price of the “short-term holders” (STHs).
The STHs refer to the investors who bought their coins within the last 155 days. At present, the average cost basis of this cohort stands at $38,750. In bullish periods, this level has often been a point of major support for the asset, and Bitcoin came quite close to retesting it during its latest drawdown.
Opposite to the STHs are the “long-term holders” (LTHs), whose realized price is shown by the green curve in the chart. The indicator’s value is only $18,740 for this cohort currently, implying that these HODLers are carrying high amounts of profits.
The purple line in the graph represents the “adjusted realized price,” which is a metric that provides a baseline for the market in general. Bitcoin found its bottom back in September when it retested this level. Currently, the indicator’s value stands…
Click Here to Read the Full Original Article at NewsBTC…


