Wyckoff Analysis (WA) aims to understand why prices of stocks and other market items move due to supply and demand dynamics. It typically is applied to any freely traded market where larger or institutional traders operate (commodities, bonds, currencies, etc.). In this article we will apply WA to the cryptocurrency Storj ($STORJ) to make a forecast for approximate future events.
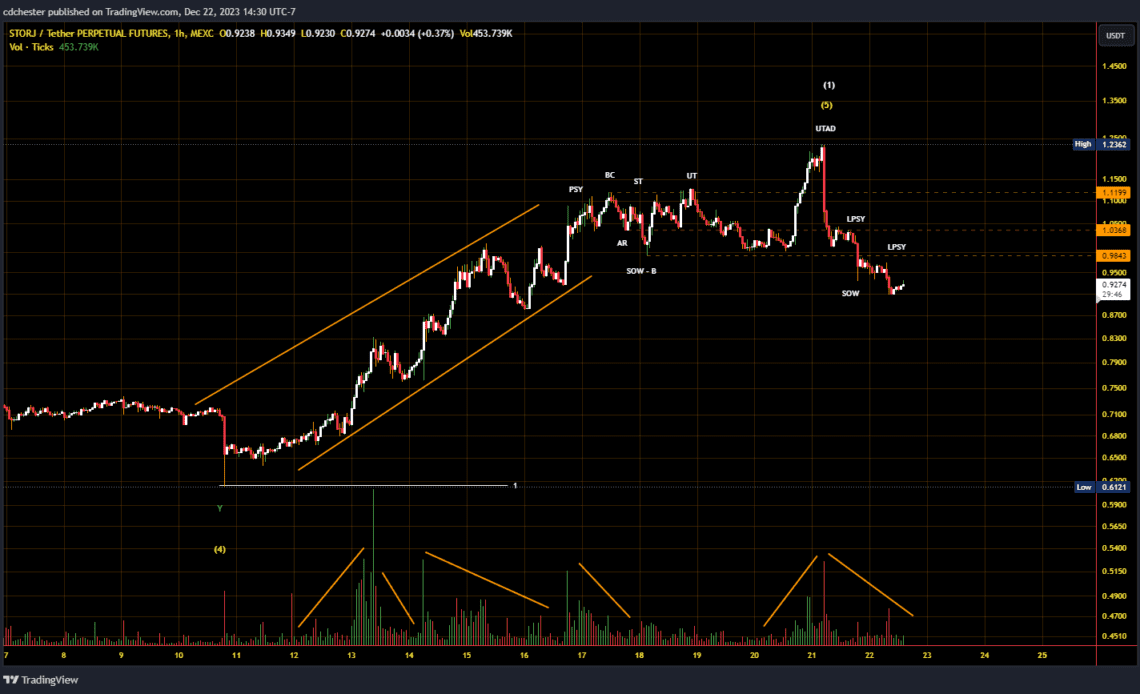
Storj Price Data from MEXC Futures | Source: STORJUSDT.P on tradingview.com.
Link to the raw image: https://www.tradingview.com/x/BGsOkzGM
Storj is currently in Phase E of a Wyckoff Distribution Schematic #1. StockCharts says this about Phase E in their article on the Wyckoff Method:
Phase E depicts the unfolding of the downtrend; the stock leaves the TR and supply is in control. Once TR support is broken on a major SOW, this breakdown is often tested with a rally that fails at or near support. This also represents a high-probability opportunity to sell short. Subsequent rallies during the markdown are usually feeble. Traders who have taken short positions can trail their stops as price declines. After a significant down-move, climactic action may signal the beginning of a re-distribution TR or of accumulation.
The trading range for Storj was $1 – $1.12 and it has concretely fallen below that. From the picture below a major SOW has occurred, more so pointing to a Distribution occurring. This also coincides with our analyst’s Elliott Wave (EWT) view on Storj. They predict a small rally as Storj continues to fall in its Wave 2. The majority of the liquidity (per its relevant Volume Profile) is between the 38.2% and 61.8% LFR at $0.56 and $0.76 respectively. A liquidity cluster is typically expected between these LFRs in EWT leading us to the think a Wave 2 correction is happening. Additionally, the cluster is in the price range of the subwave 4, an EWT guideline.
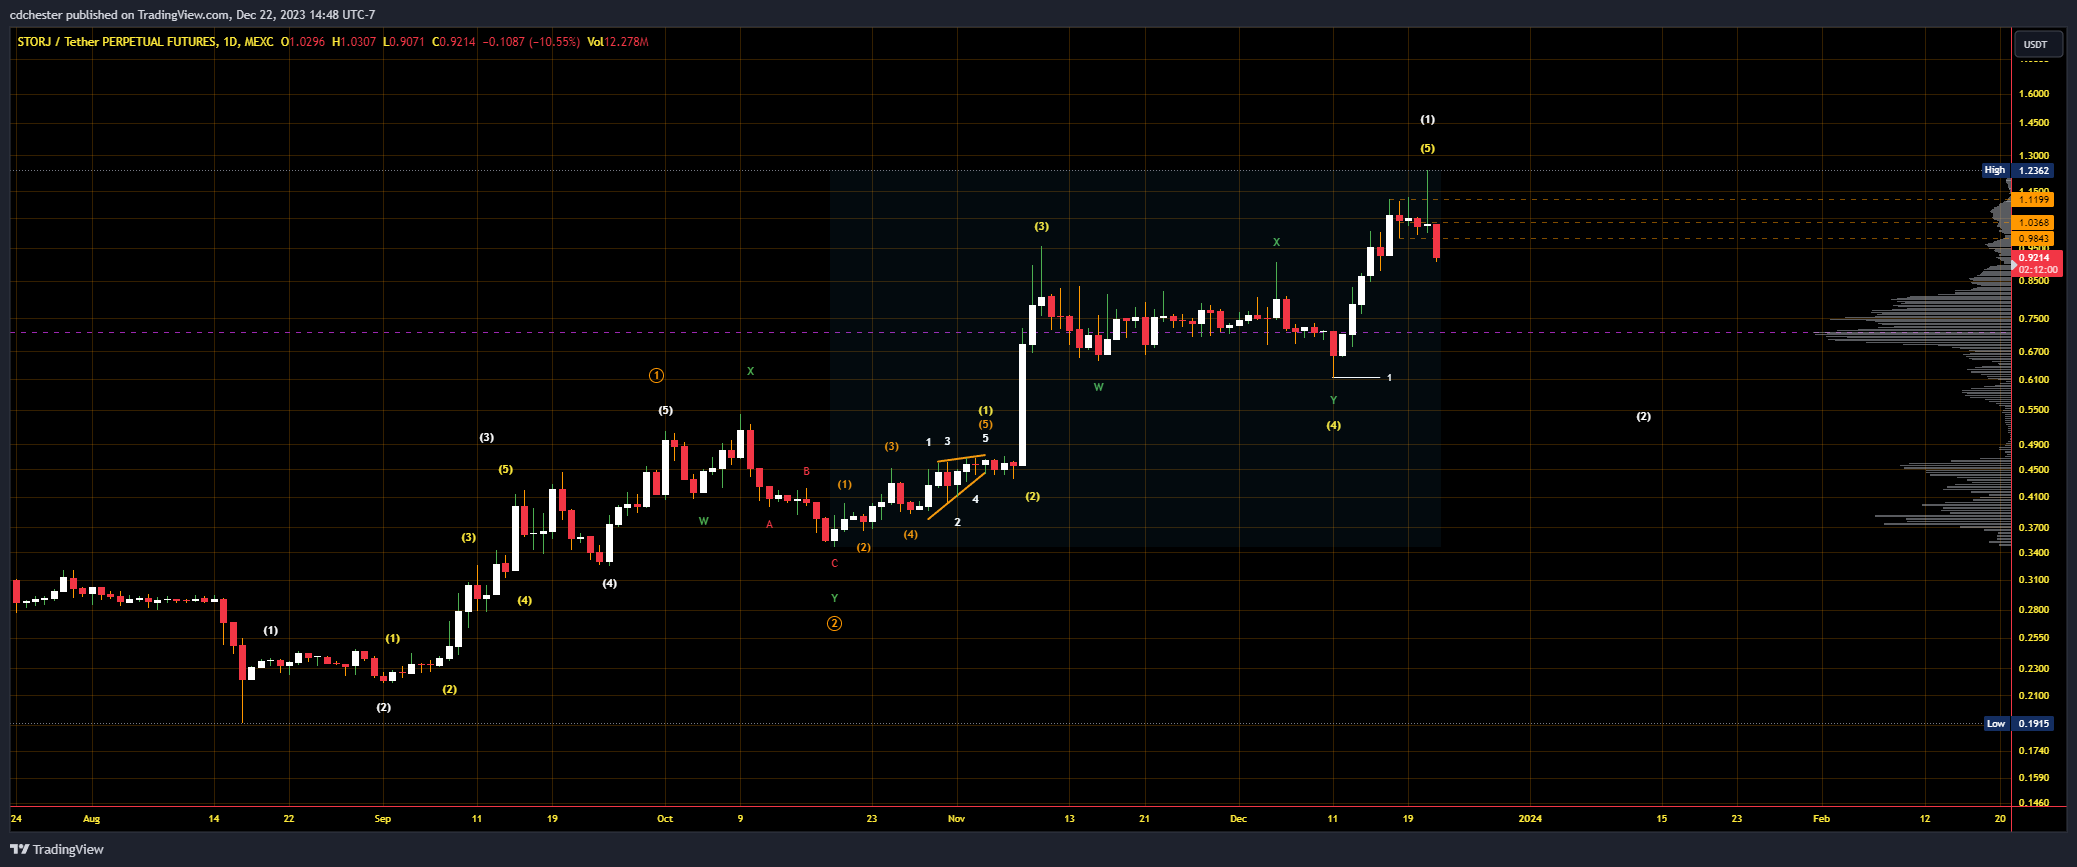
Storj Price Data from MEXC Futures | Source: STORJUSDT.P on tradingview.com.
Link to the raw image: https://www.tradingview.com/x/dD8hv9Aj
Below is the typical schematic for a Wyckoff Distribution Schematic #1.
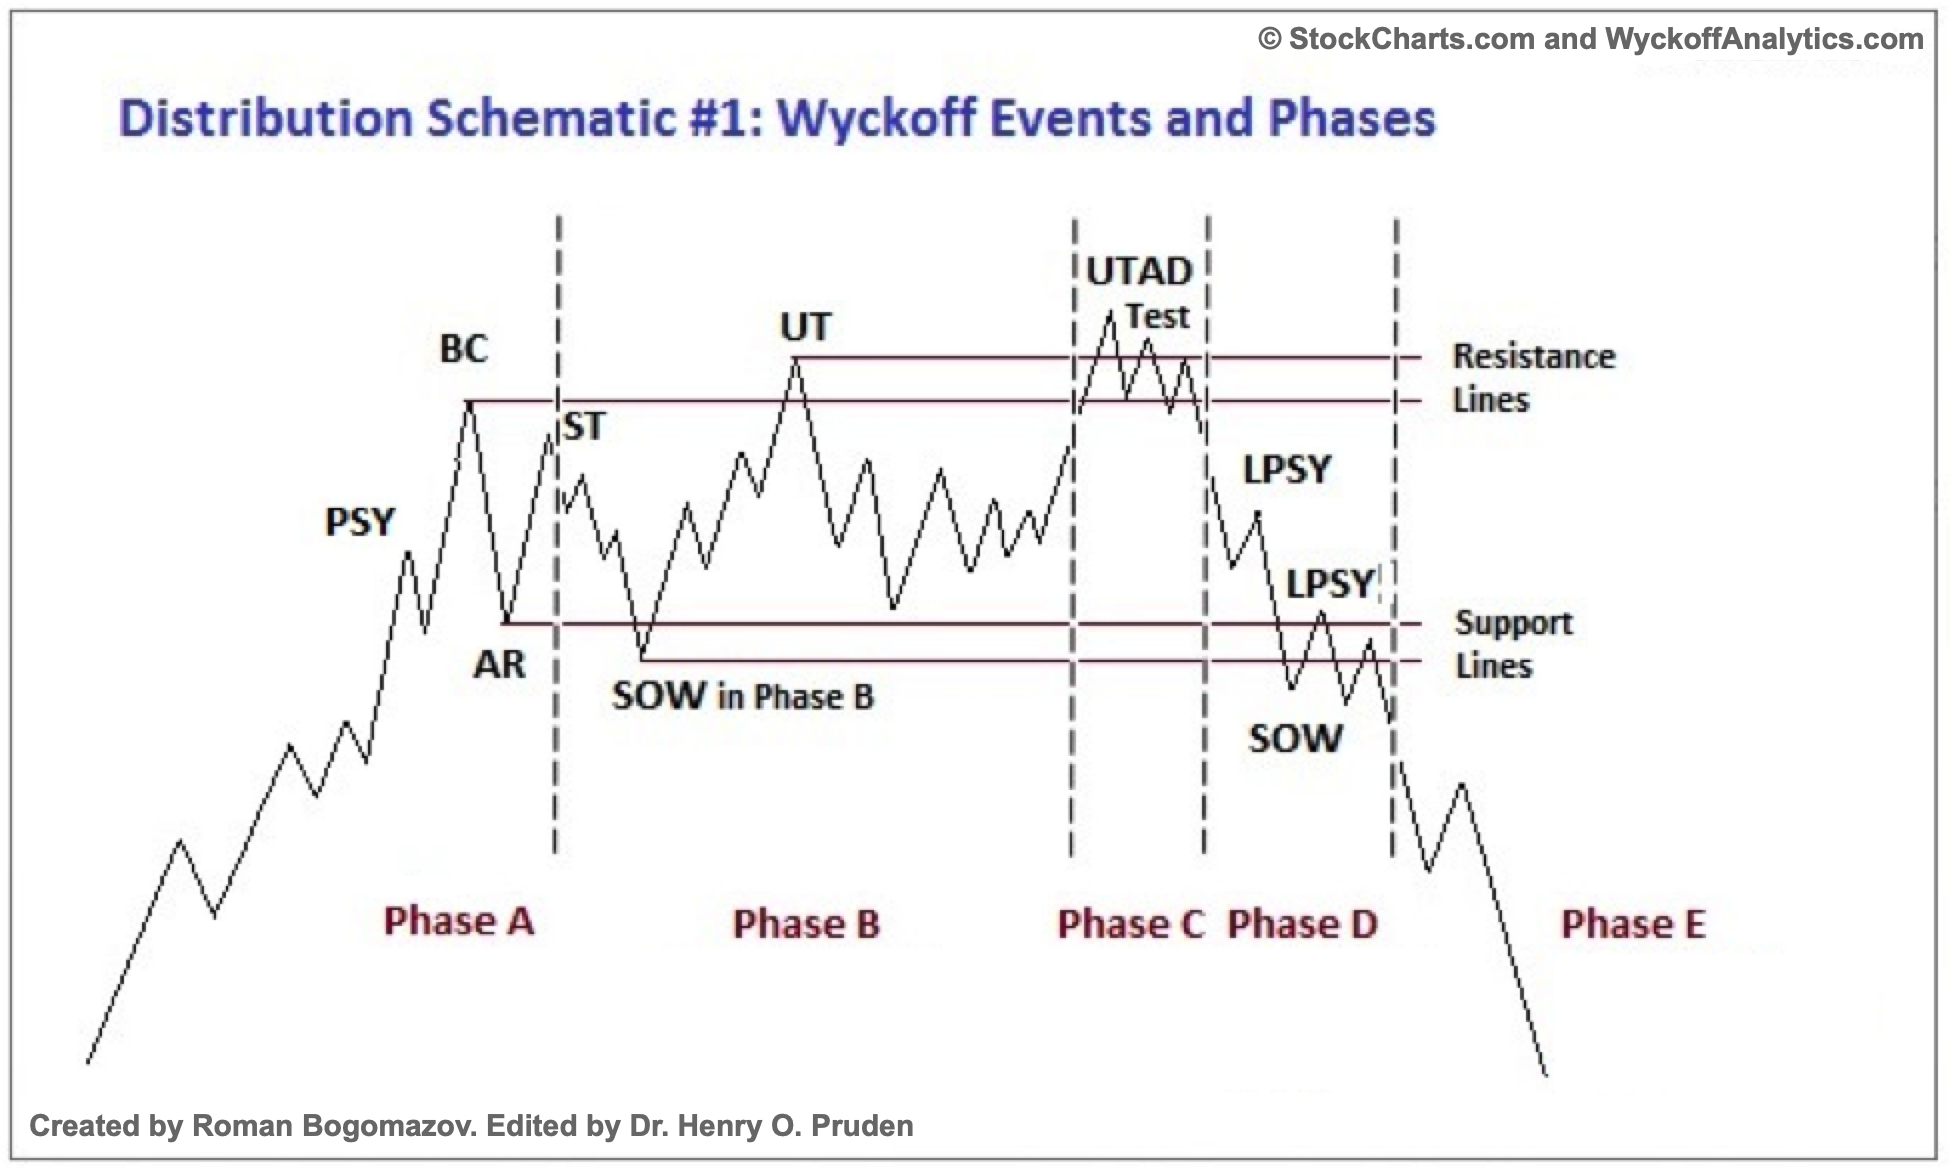
Wyckoff Distribution Schematic #1 | Source: StockCharts.com
Glossary
All quotes are from the first link in Supplemental Reading.
Preliminary Supply (PSY) – “where large interests begin to unload shares in quantity after a pronounced up-move”
Buying Climax (BC) – large operators selling their shares while the public buys them at a premium during a period of huge…
Click Here to Read the Full Original Article at NewsBTC…


