The Polkadot price has breached the $5 resistance mark in the past trading sessions. Over the last 24 hours, DOT has appreciated by 3.8%. The price of Bitcoin has been surging, which has caused other altcoins to also move upward on their respective charts.
When Bitcoin crossed the $18,000 price mark, other altcoins broke past their immediate resistance marks. Polkadot price momentum remains bullish in the shorter time frame. The technical outlook for DOT showed that despite a price correction, accumulation on the chart increased.
Polkadot demand also showed an increase on its chart. The asset’s price has to remain above the $5.40 support line and breach the $6.20 resistance level if the coin has to maintain a bullish stance for a longer time frame.
The daily chart of DOT also points towards an incoming fall in price, which means that traders might be presented with shorting opportunities. Currently, DOT is trading at an 89% discount from its all-time high secured in 2021.
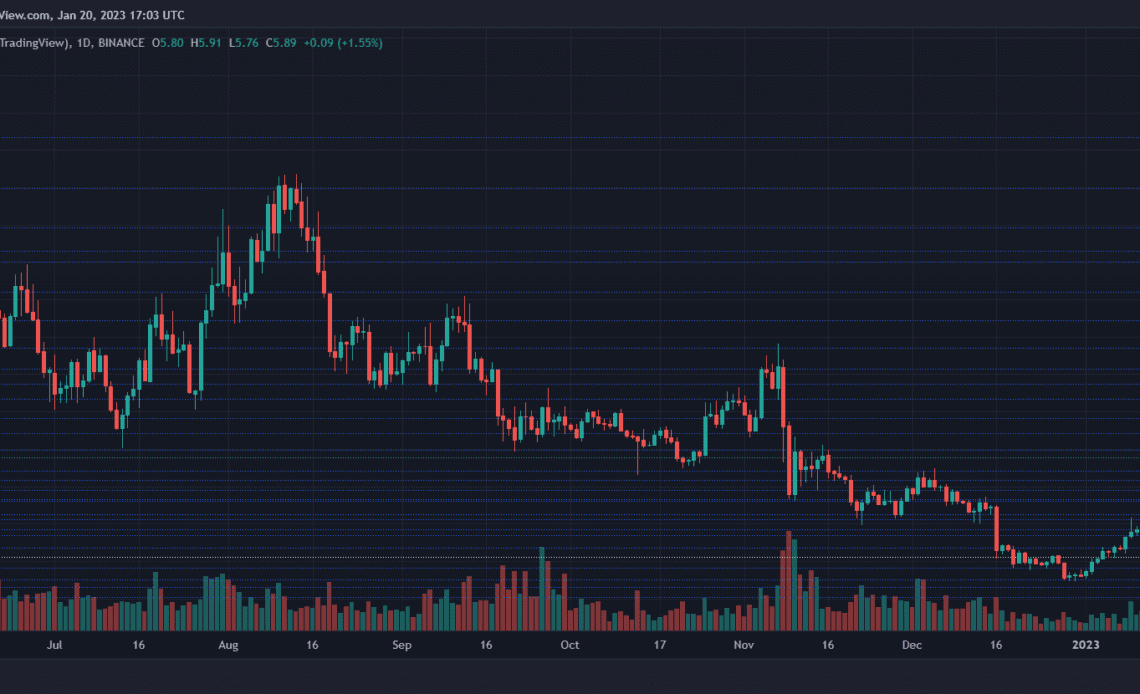
Polkadot Price Analysis: One-Day Chart
DOT was exchanging hands at $5.89 at the time of writing. Polkadot had formed a cup and handle pattern, which means that the bullish momentum can continue, which is why Polkadot resumed its northbound journey on the daily chart.
Overhead resistance for the coin stood at $6. Toppling the $6 mark can take the coin to $6.20. As Polkadot was overbought, demand for the coin could trickle down.
This can cause the price to fall for a few trading sessions before it starts to rise again. In case of a price retracement, DOT will encounter its local support at $5.40 and then at $5.33.
These two levels can be an entry point for buyers, as the altcoin will rise in value after it touches these support lines. The amount of Polkadot traded in the last session was still green, indicating that buying pressure remained.
Technical Analysis

The asset had secured a multi-month high in registering demand in the past week. The coin was overvalued a week ago, and as a result, demand has retraced slightly. The Relative Strength Index fell back from the 80 mark, which was a sign of the asset being overbought.
At press time, DOT again registered an uptick, indicating that buying strength was building again. On that note, the price of DOT was above the 20-Simple Moving Average line, hinting that…
Click Here to Read the Full Original Article at NewsBTC…


