A quant has explained using past trends of the Bitcoin adjusted Spent Output Profit Ratio (aSOPR) whether the current cycle has yet met all the bottom conditions.
Bitcoin aSOPR EMAs Are Approaching Golden Cross
As an analyst in a CryptoQuant post explained, the aSOPR EMAs are looking to form a golden cross soon. The “Spent Output Profit Ratio” (SOPR) indicates whether the average Bitcoin investor is selling at a profit or at a loss right now.
The “Adjusted SOPR” (aSOPR) is a modified version of this metric that excludes from the data all selling done within an hour of first purchasing the coins. The advantage of doing this is that such short-term transactions are noise in the data and, thus, don’t have any significant implications on the market.
When the value of this indicator is greater than 1, it means the holders are selling coins at some profit right now. On the other hand, values below the threshold suggest the overall market realizes some loss at the moment.
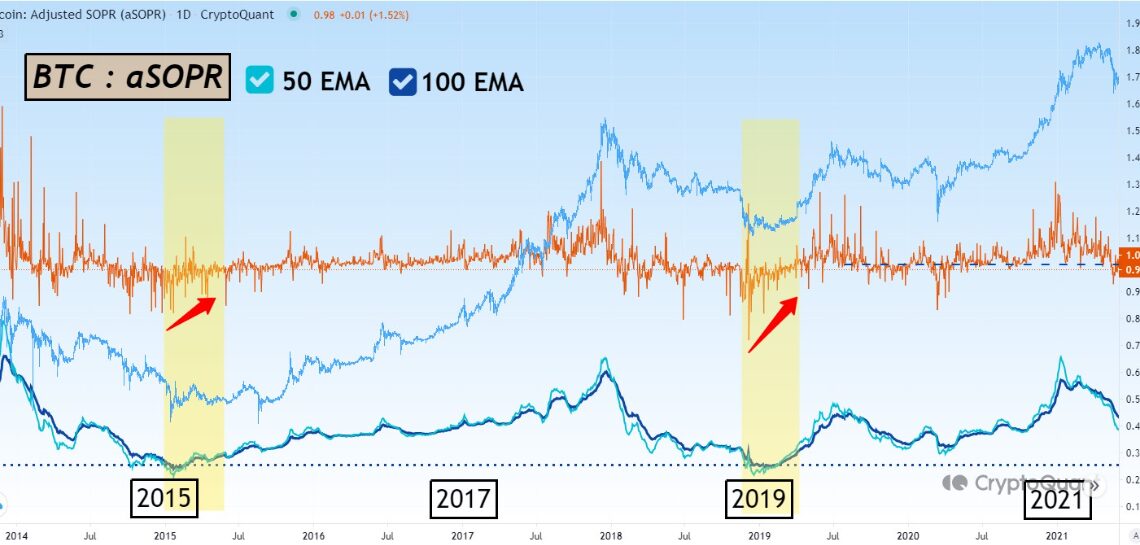
Naturally, the aSOPR being exactly equal to 1 implies that the investors are just breaking even on their current selling. Now, here is a chart that shows the trend in the Bitcoin aSOPR, as well as its 50-day and 100-day exponential moving averages (EMAs) during the 2014-2015 and 2018-2019 bear markets:
The trends in the metric during the previous bear market bottoms | Source: CryptoQuant
As shown in the above graph, the quant marked the relevant zones for the indicator in the previous two cycles. It looks like the aSOPR hit bottom values below one and then caught an overall uptrend as the price of Bitcoin itself bottomed out in both cycles. The indicator hitting low levels under one like this suggests that the investors heavily capitulated then, which detoxed the market from weak hands and hence helped the price finally bottom out.
Also, in both these bear markets, the 100-day EMA declined to the same lowest level (as represented by the lower dotted line in the chart) and rebounded back from it as this bottoming process took place. It also seems like a return to a bullish trend started with a golden cross of the two EMAs, with the 50-day crossing back above the 100-day.
Now, here is a chart that displays how the aSOPR and its EMAs are looking in the current cycle so far:
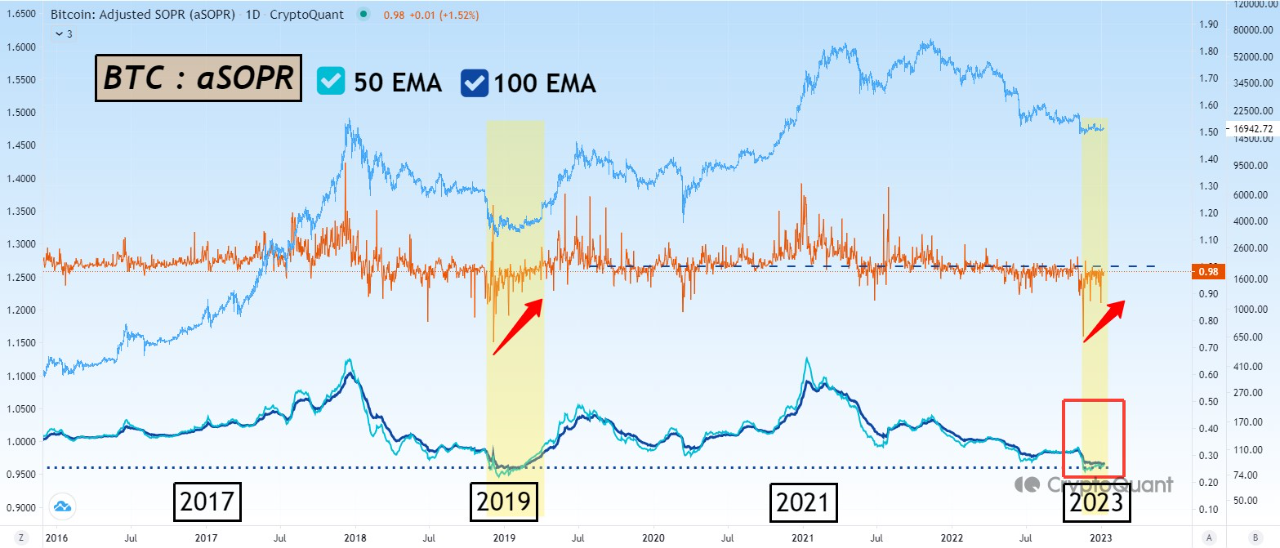
The value of the metric seems to have been climbing recently | Source: CryptoQuant
The chart shows that the same pattern of the Bitcoin aSOPR forming a bottom and then catching an overall uptrend has already…
Click Here to Read the Full Original Article at NewsBTC…


