In recent weeks, the meme coin Shiba Inu (SHIB) has shown signs of recuperation, gradually recovering from its yearly low of $0.00000597, reached on June 10. SHIB was following the pawprints of its rival, Dogecoin (DOGE), which recently garnered momentum following a profile update from Elon Musk. As the value of SHIB began to move upward, anticipation around the forthcoming release of Shibarium, a layer 2 solution, also began to ripple through the investor community.
The announcement that Shibarium will be unveiled at the Blockchain Futurist Conference held from August 15-16, 2023, in Canada, ignited a flicker of optimism. However, there is still no clear confirmation for a trend reversal from a technical perspective for SHIB.
Can Shiba Inu Finally Enter Bullish Territory?
While DOGE has already breached the threshold of the 200-day EMA (Exponential Moving Average) – a widely respected metric in chart analysis – SHIB has yet to break through this key technical indicator. In simplified terms, an asset above the 200-day line indicates an uptrend, while trading below suggests a downtrend.
A classical approach would recognize a strong buy signal when the price moves from below to above the trend line. Investors with an eye on SHIB continue to await for this buy signal. This is despite the meme coin currently trading 55% higher compared to its low on June 10.
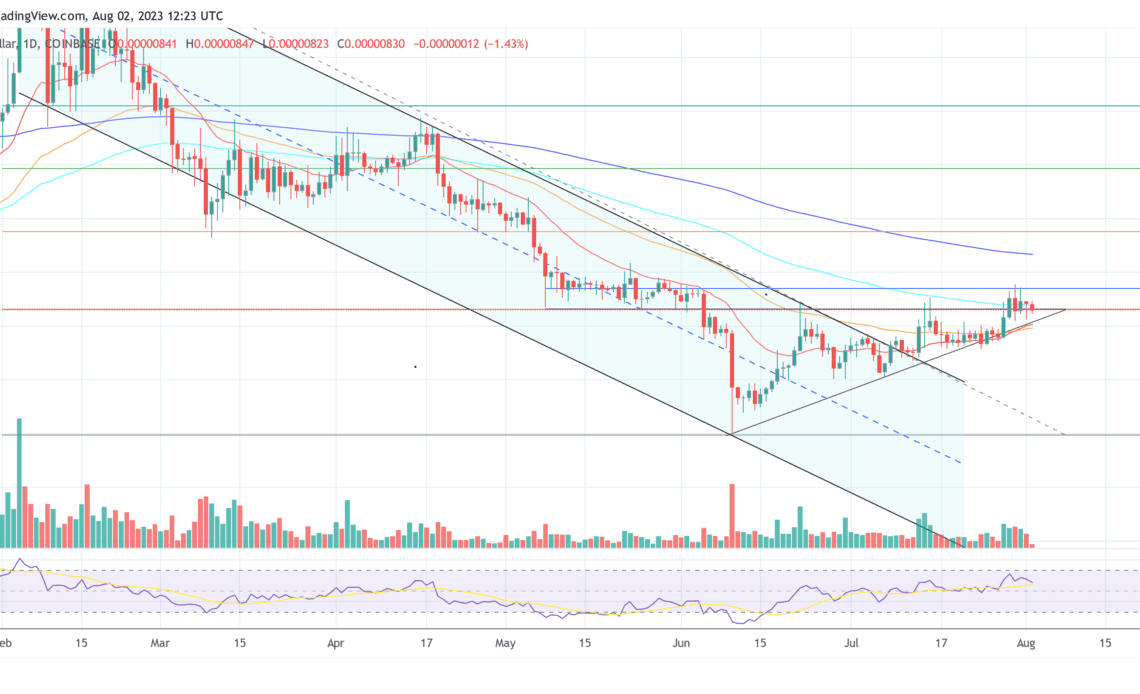
Remarkably, the recent positive price trend did enable SHIB to ascend beyond the 50-day EMA (orange), a modest victory in its own right. At the moment, SHIB faces an uphill battle against the 100-day EMA, priced at $0.00000840. As of press time, Shiba Inu traded just shy of this mark, at $0.00000830.
Another bullish argument is that the meme coin recently broke out of the ascending triangle formation that had held it captive since mid-June. SHIB should not fall back below the formation’s former resistance at $0.00000831 to confirm the breakout. Remarkably, the 23.6% Fibonacci retracement level is also at this level, making this price twice as important.
If Shiba Inu can maintain its current position and use the 23.6% Fibonacci level as support, it could successfully break above the horizontal resistance around $0.00000870. Then, a subsequent jump to the bullish boundary – the 200-day EMA at $0.00000933 – could be on the cards.
Should SHIB bulls accomplish this feat, the price would technically…
Click Here to Read the Full Original Article at NewsBTC…


