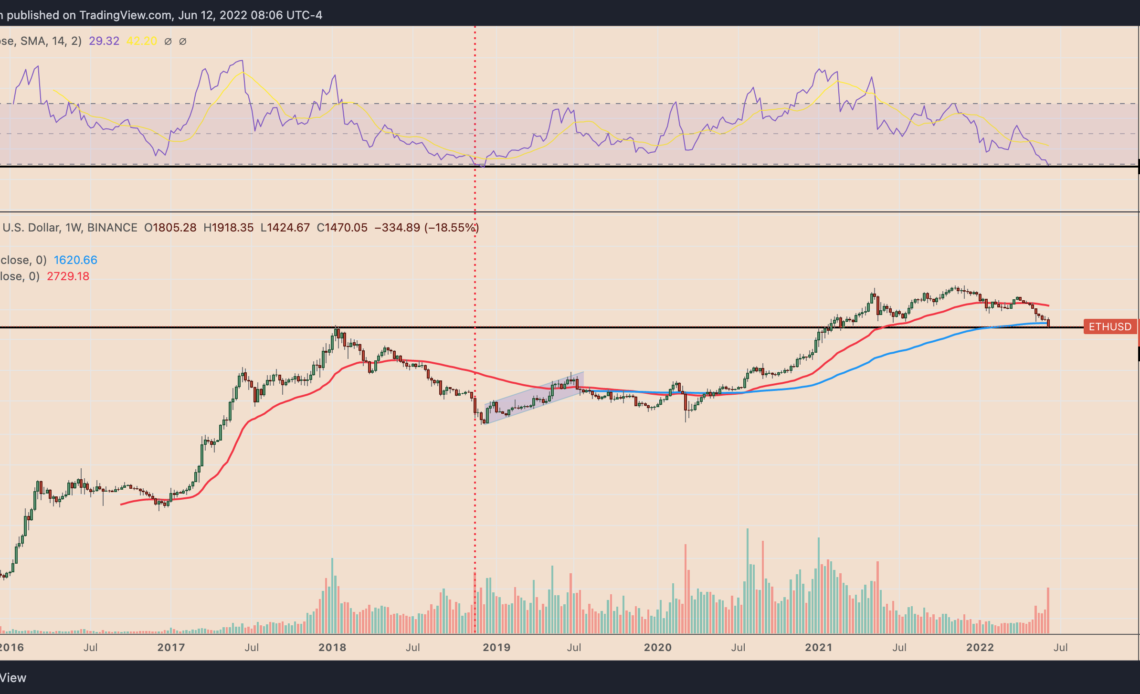
Ethereum’s native token Ether (ETH) entered its “oversold” territory this June 12, for the first time since November 2018, according to its weekly relative strength index (RSI).
This is the last time $ETH went oversold on the weekly (hasn’t confirmed here yet).
I had no followers, but macro bottom ticked it.
Note, you can push way lower on weekly rsi, not trying to catch a bottom. https://t.co/kLCynTKTcS
— The Wolf Of All Streets (@scottmelker) June 12, 2022
ETH eyes oversold bounce
Traditional analysts consider an asset to be excessively sold after its RSI reading fall below 30. Furthermore, they also see the drop as an opportunity to “buy the dip,” believing an oversold signal would lead to a trend reversal.
Ether’s previous oversold reading appeared in the week ending on Nov. 12, 2018, which preceded a roughly 400% price rally, as shown below.
While past performances are not indicators of future trends, the latest RSI’s move below 30 raises the possibility of Ether undergoing a similar—if not an equally sharp—upside retracement in the future.
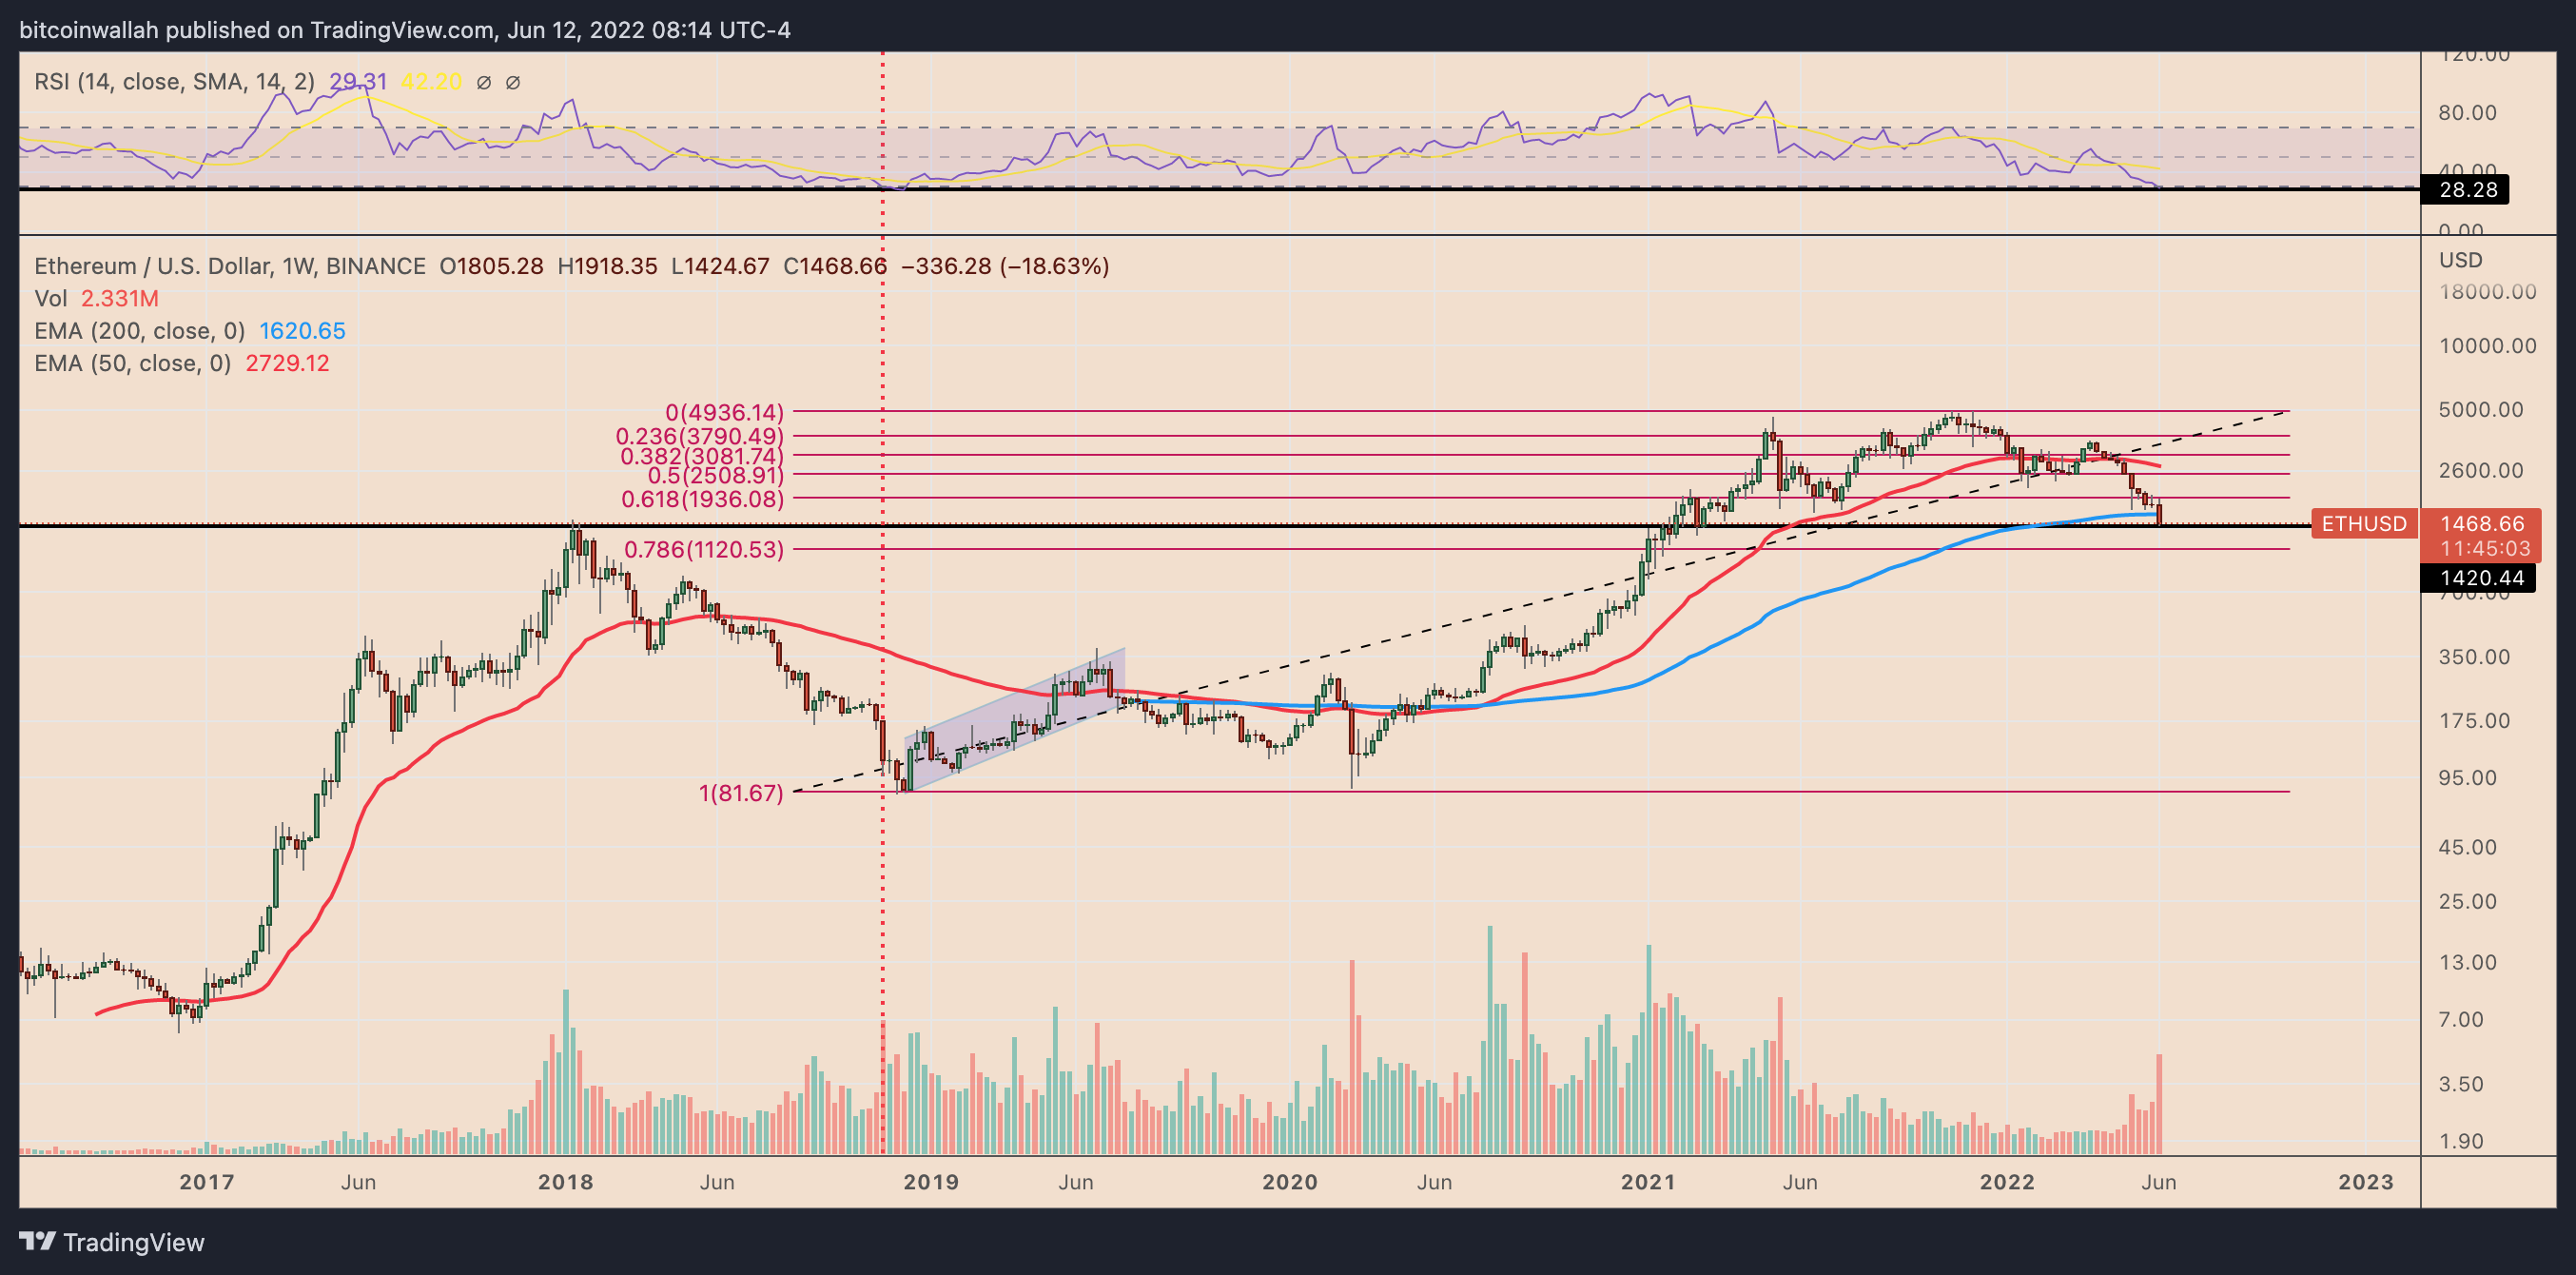
Suppose ETH logs an oversold bounce. Then, the ETH/USD pair’s immediate challenge would be to reclaim its 200-week exponential moving average (200-week EMA; the blue wave) near $1,620 as its support.
If it does, bulls could eye an extended upside move towards the 50-week EMA (the red wave) above $2,700, up almost 100% from today’s price.
If not, Ether could resume its downtrend, with $1,120 serving as the next target, a level coinciding with the token’s 0.782 Fib line, as shown in the chart below.
Macro headwinds and a $650 Ether price target
The RSI-based bullish outlook appears against a flurry of bearish headwinds, ranging from persistently higher inflation to a classic technical indicator with a downward bias.
In detail, Ether’s price decline by more…
Click Here to Read the Full Original Article at Cointelegraph.com News…


