The Polkadot price posted significant gains over the last week after Bitcoin showed recovery on its chart. Other altcoins have also moved in the same direction. At the moment, however, DOT has been trying to breach the immediate resistance of $5.
In the past 24 hours, DOT noted a fall of 2%, but that could be attributed to a slight fall in demand for the altcoin. The technical outlook for Polkadot remains bullish. Buyers and demand for the altcoin have to keep mounting, and soon DOT will travel above the $5 level to trade near the $6 level.
Accumulation has been growing in the last week as buyers have exceeded sellers at press time. It is critical, however, that DOT surpasses the $5 mark, or the coin will begin to trade lower, resulting in a loss of investor interest.
The market structure for DOT remains bullish as the coin managed to flip a few resistance marks into support levels in the past week. A push from the buyers will certainly strengthen the bulls’ efforts to cross the stiff price ceiling of $4.90. The Polkadot price is trading 91% below its all-time high secured in 2021.
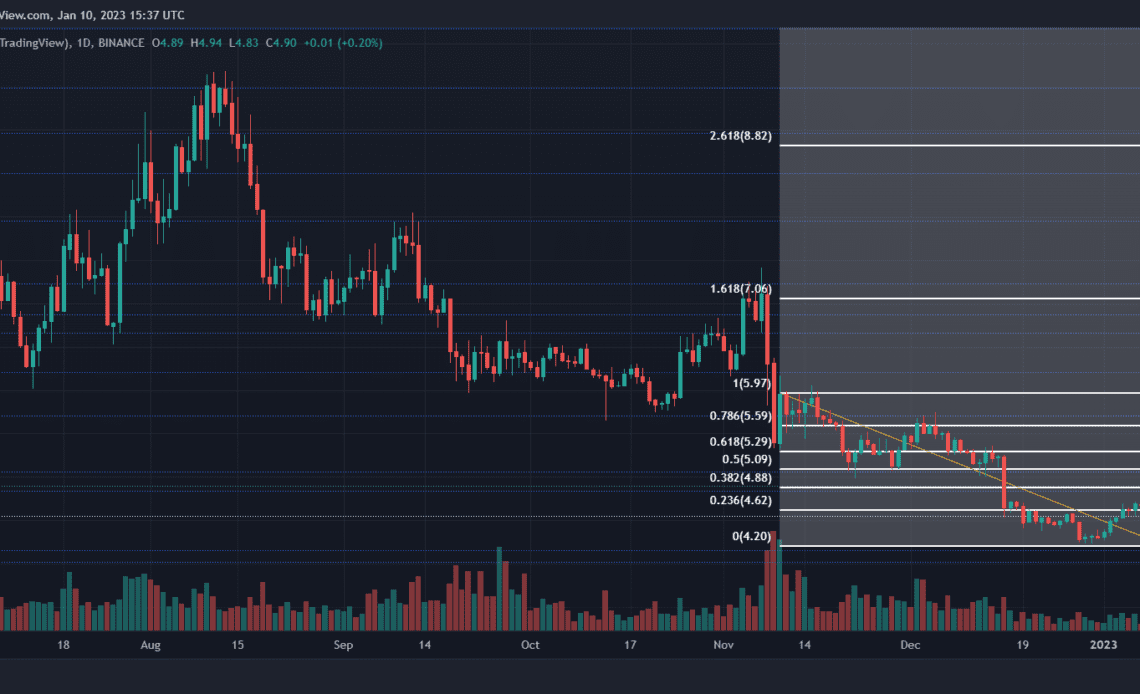
Polkadot Price Analysis: One-Day Chart
DOT was trading at $4.90 at press time. The $4.90 price level was a strong resistance point for the altcoin. Although DOT managed to break past the $4.80 resistance level, which has proven to be a tough resistance mark in the past, the coin continues to remain underneath the $5 level.
The $5 mark is crucial, as the 78.6% Fibonacci retracement level also somewhere meets the coin at that mark. A push above $5 will take the coin above $5.20.
On the other hand, one bearish push and DOT will land at $4.40 and then $4.16. The amount of DOT traded in the last session declined slightly, mirroring the minor downtick in buying strength.
Technical Analysis
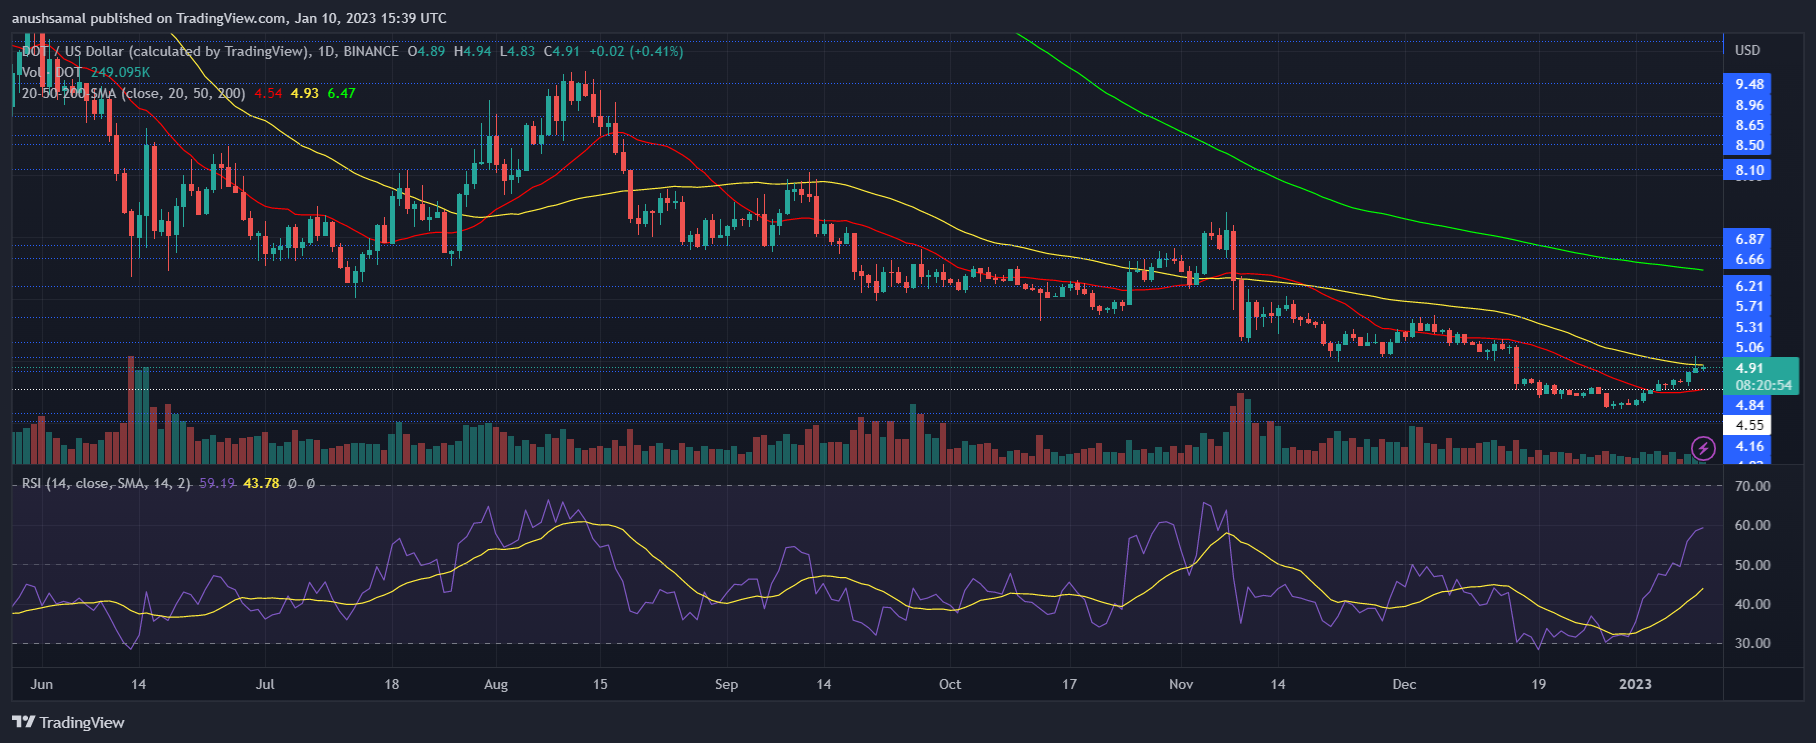
DOT made a significant recovery in buying pressure over the past week. The Relative Strength Index shot above the 60-mark, signifying the chart’s bullishness.
Similarly, the asset price moved above the 20-Simple Moving Average line (SMA), which meant buyers were driving the price momentum in the market.
Polkadot was also inching very close to the 50-SMA line, and just a slight push from buyers would help the price topple over it. A move above the 50-SMA will cause another significant rally for Polkadot.
Click Here to Read the Full Original Article at NewsBTC…


