The recent market recovery has caught most by surprise, mainly because macro conditions have certainly not improved, most notoriously with the latest CPI data at 9.1% year over year – much higher than expected.
Nevertheless, according to some surveys, inflation expectations from the market are calming off. This is a major factor contributing to the recent price rally we are experiencing now, as well as the generally oversold situation we were in just two weeks ago. In fact, the headlines that 2022 had one of the worst starts of the year for equities in decades were abundant.
Coming back to crypto, BTC continuously holding above $20k and ETH being far from the sub $1,000 mark have been taken as a sign of strength by the market. Both have been performing positively.
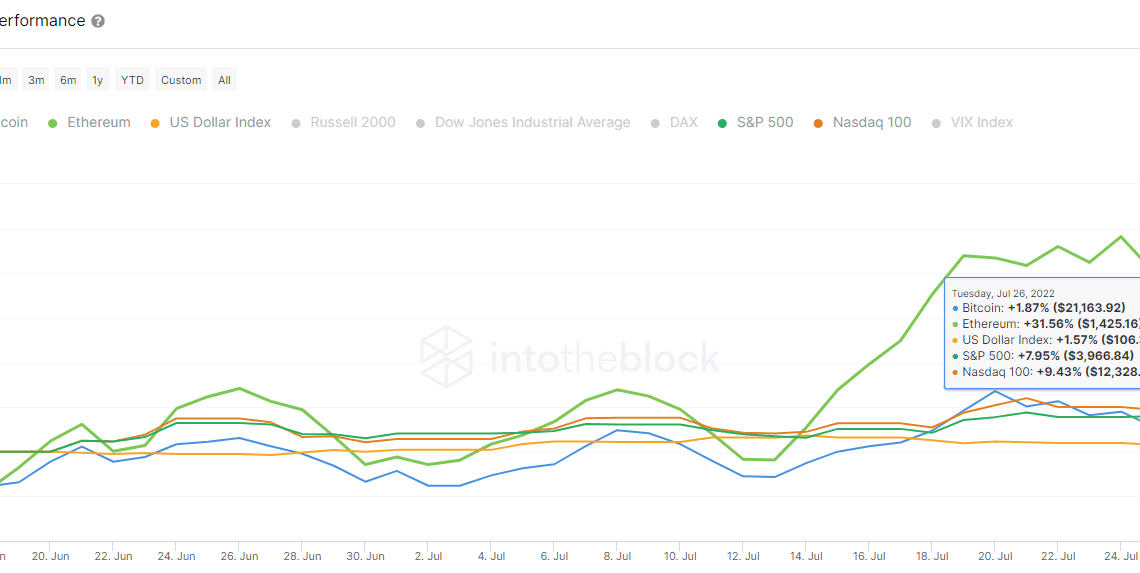
Here, it can be seen how the performance of BTC and ETH against US equities since the market bottomed on June 17th until today:
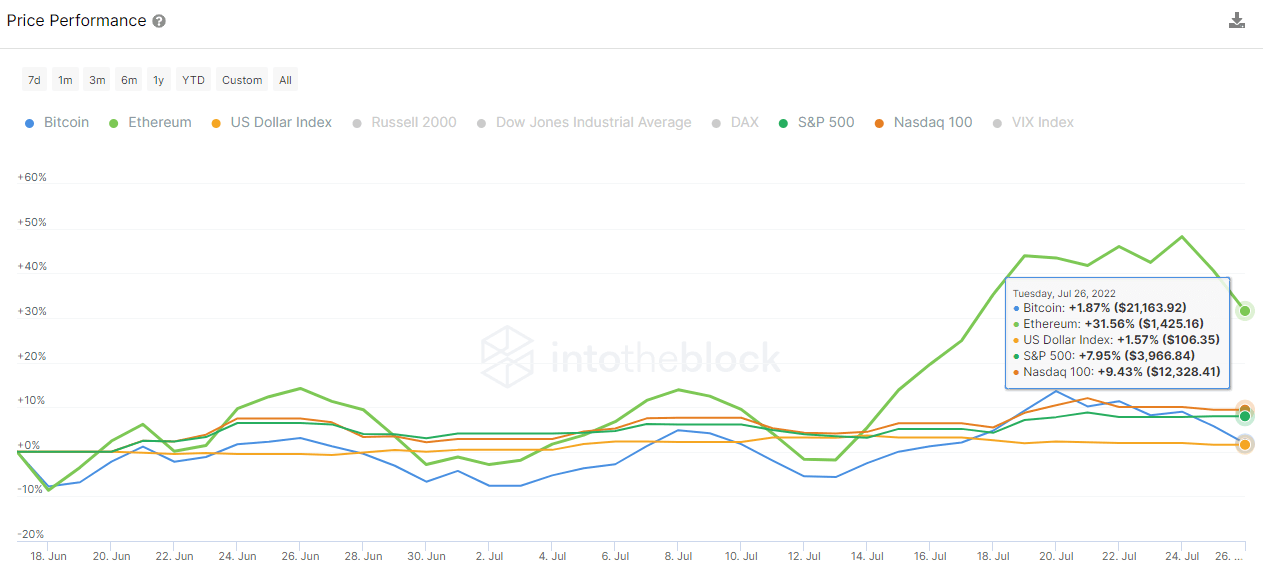
BTC price has gained almost 2% while ETH has appreciated 21%, certainly driven by the proof of stake merge coming. As can be seen above, BTC and ETH were volatile until the 12th of July, when they started their current price rally, preceding a move that equities would follow some days later.
Some analysts consider the current situation with Crypto as a proxy indicator of the market hunger for risk-rated assets. Besides the large unwind of the market during this year, BTC has maintained relatively steady over the $20K price mark, which has probably been seen as a sign of consolidation and has helped drive the recovery narrative.
The decoupling mentioned before can be easily spotted if we take a look at the historical correlation of BTC against US equities indexes such as the S&P 500, or Nasdaq 100:
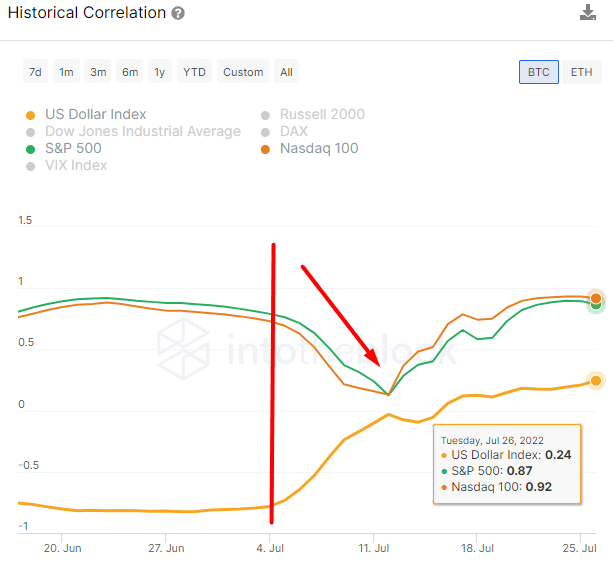
Before the 4th of July, the crypto market was basically a mirror of the US indexes, keeping a correlation close to 0.8-0.9….
Click Here to Read the Full Original Article at Ethereum (ETH) News | CryptoSlate…


