An analyst has explained what path Bitcoin might need to follow to surge to a new all-time high (ATH) target of $92,190.
Bitcoin Needs To Breach This Resistance Barrier To Rise To New ATH
In a new thread on X, analyst Ali discussed whether the BTC price has hit the top. The one signal the analyst has pointed out that may point towards the top has been the massive scale of profit-taking that the market has seen recently.
Ali is waiting for another confirmation before the top can be confirmed. In the scenario that the top gets validated, these are the targets the analyst has marked based on on-chain data.
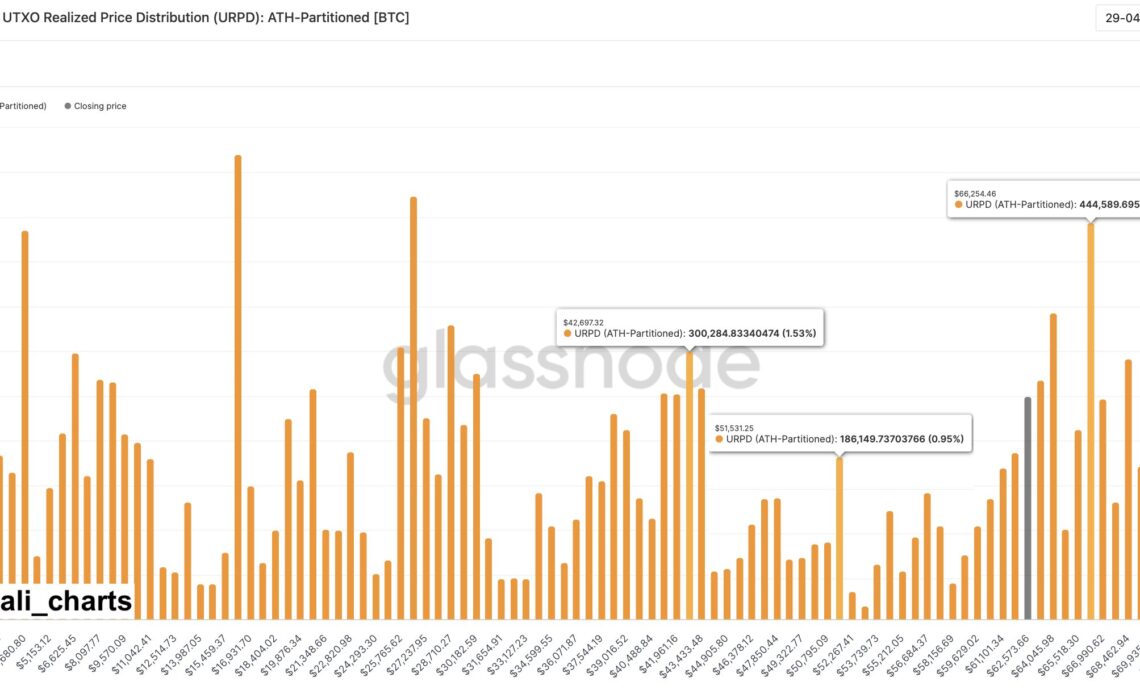
The distribution of UTXOs across the various price levels | Source: @ali_charts on X
The above chart shows the Bitcoin UTXO Realized Price Distribution (URPD) data from Glassnode, which tells us how many coins were last bought at what price levels.
Generally, the cost basis is an important level for any investor, so they are likely to show some reaction when a retest of it happens. This reaction is the largest when many investors share their cost basis around the same level.
When this retest happens from above, the holders may respond by buying more, as they could see the drop as a dip opportunity. As such, large cost basis zones below the current price can prove to be centers of support.
“If the market top is confirmed, BTC could drop toward $51,530 or even $42,700!” notes Ali, given that these two levels are the next major support lines for the coin.
The analyst says, however, that if BTC can instead break the $66,250 level, which is a source of major resistance right now since these loss holders may be desperate to exit at their break-even, then this bearish outlook could become invalidated.
An on-chain pricing model could provide some hints about what might happen when such a break occurs.
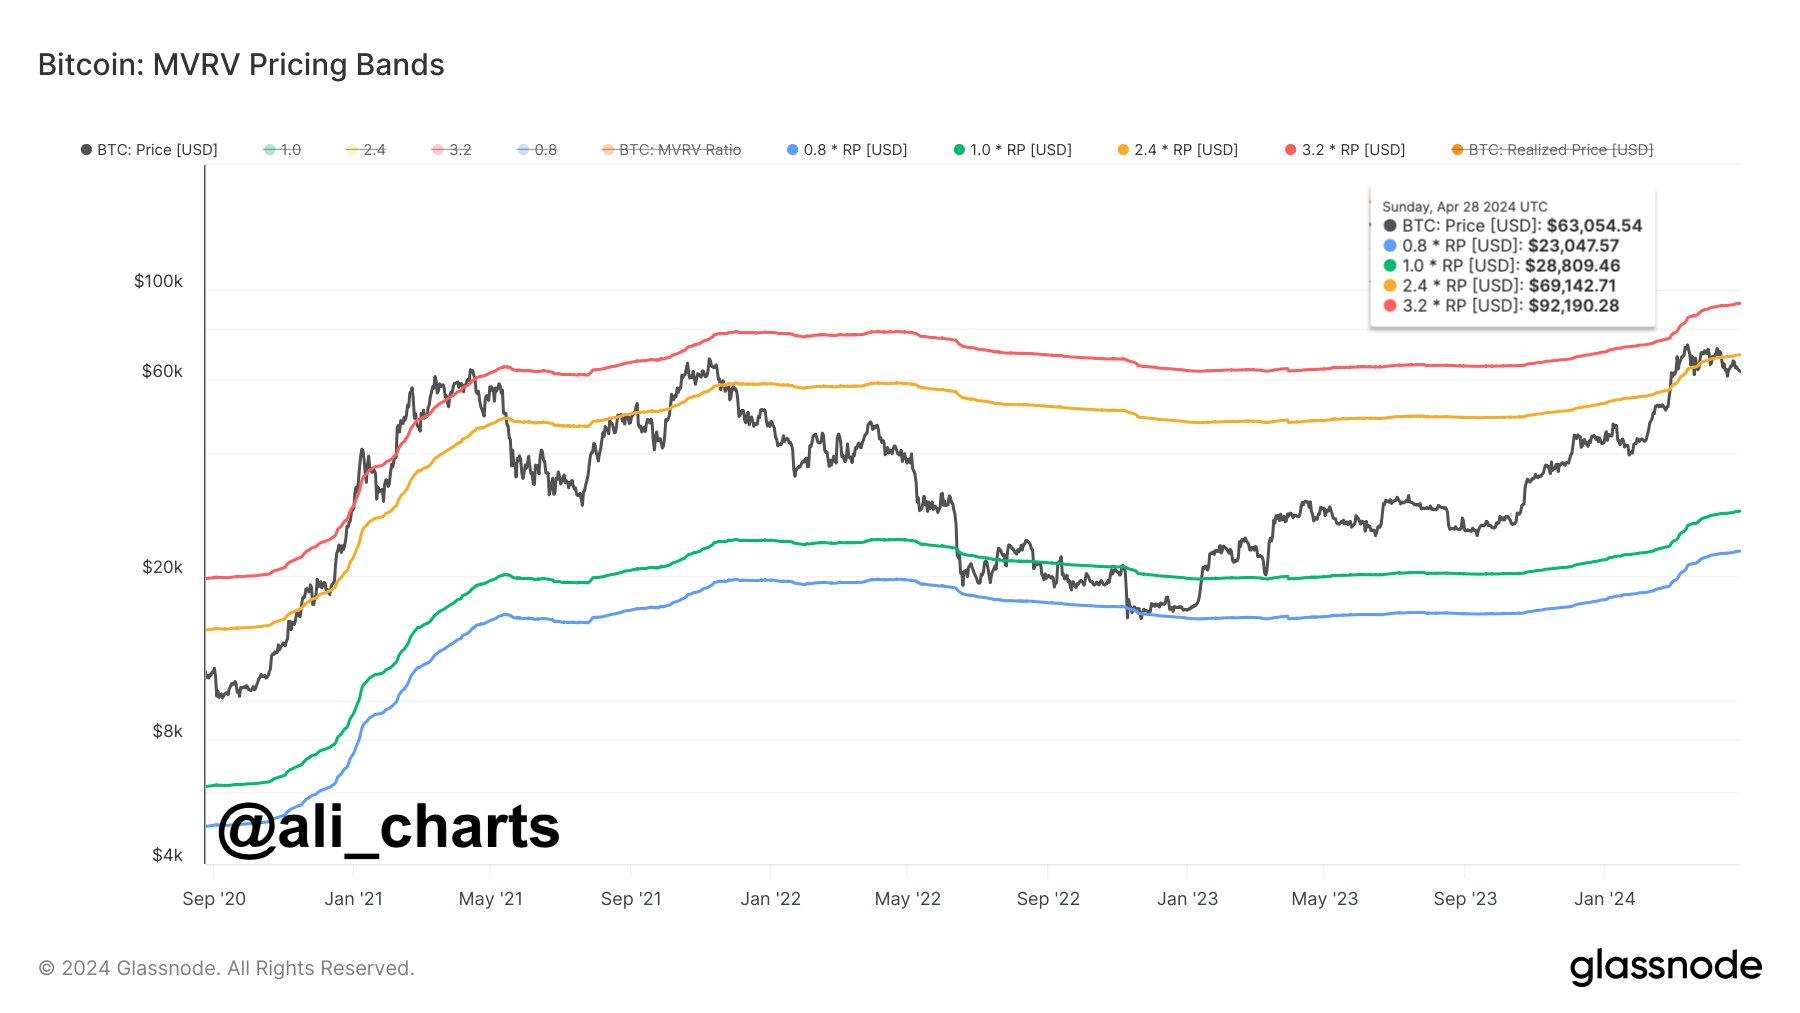
The trend in the MVRV Pricing Bands for BTC over the past few years | Source: @ali_charts on X
The Market Value to Realized Value (MVRV) Pricing Bands is a model that, in short, tells us about where the different multipliers of the average cost basis of the entire market currently lie.
The chart shows that the market cost basis is currently at $28,800. Historically, three multipliers of this metric have been relevant for the asset: 0.8x, 2.4x, and 3.2x.
The 0.8x level is where bottoms occur, while the 3.2x line is a probable spot for tops to form. Bull rallies in proper have occurred after a breach of the 2.4x level.
At present,…
Click Here to Read the Full Original Article at NewsBTC…


