Bitcoin price started an upside correction from the $38,500 support zone. BTC could gain bullish momentum if it clears the $40,500 resistance zone.
- Bitcoin price is attempting a recovery wave from the $38,500 support zone.
- The price is trading below $40,000 and the 100 hourly Simple moving average.
- There is a major bearish trend line forming with resistance near $40,400 on the hourly chart of the BTC/USD pair (data feed from Kraken).
- The pair might struggle to recover above the $40,400 and $40,500 resistance levels.
Bitcoin Price Attempts Recovery
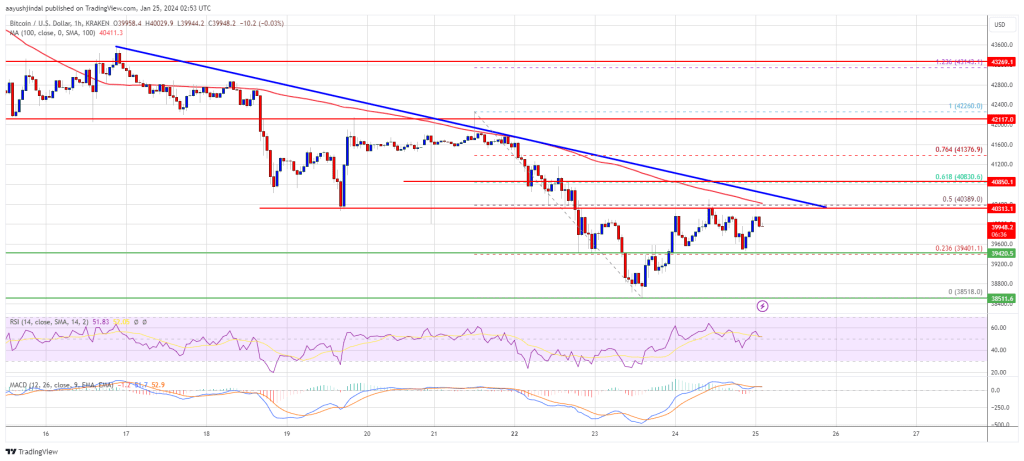
Bitcoin price extended its decline below the $40,000 support zone. BTC even spiked below the $49,200 level and tested the $38,500 support zone. A new weekly low was formed near $38,518 and the price started an upside correction.
There was a recovery wave above the $39,200 and $39,500 levels. However, Bitcoin is now trading below $40,000 and the 100 hourly Simple moving average.
Immediate resistance is near the $40,400 level. There is also a major bearish trend line forming with resistance near $40,400 on the hourly chart of the BTC/USD pair. The trend line is close to the 50% Fib retracement level of the downward wave from the $42,260 swing high to the $38,518 low.
The next key resistance could be $40,500, above which the price could rise and test $40,850. It is close to the 61.8% Fib retracement level of the downward wave from the $42,260 swing high to the $38,518 low.
Source: BTCUSD on TradingView.com
A clear move above the $40,850 resistance could send the price toward the $41,500 resistance. The next resistance is now forming near the $42,000 level. A close above the $42,000 level could push the price further higher. The next major resistance sits at $42,500.
Another Drop In BTC?
If Bitcoin fails to rise above the $40,400 resistance zone, it could start another decline. Immediate support on the downside is near the $39,400 level.
The next major support is $38,500. If there is a close below $38,500, the price could gain bearish momentum. In the stated case, the price could visit the $37,000 support in the near term.
Technical indicators:
Hourly MACD – The MACD is now losing pace in the bearish zone.
Hourly RSI (Relative Strength Index) – The RSI for BTC/USD is now above the 50 level.
Major Support Levels – $39,400, followed by $38,500.
Major Resistance Levels – $40,400, $40,500, and $40,850.
…
Click Here to Read the Full Original Article at NewsBTC…


