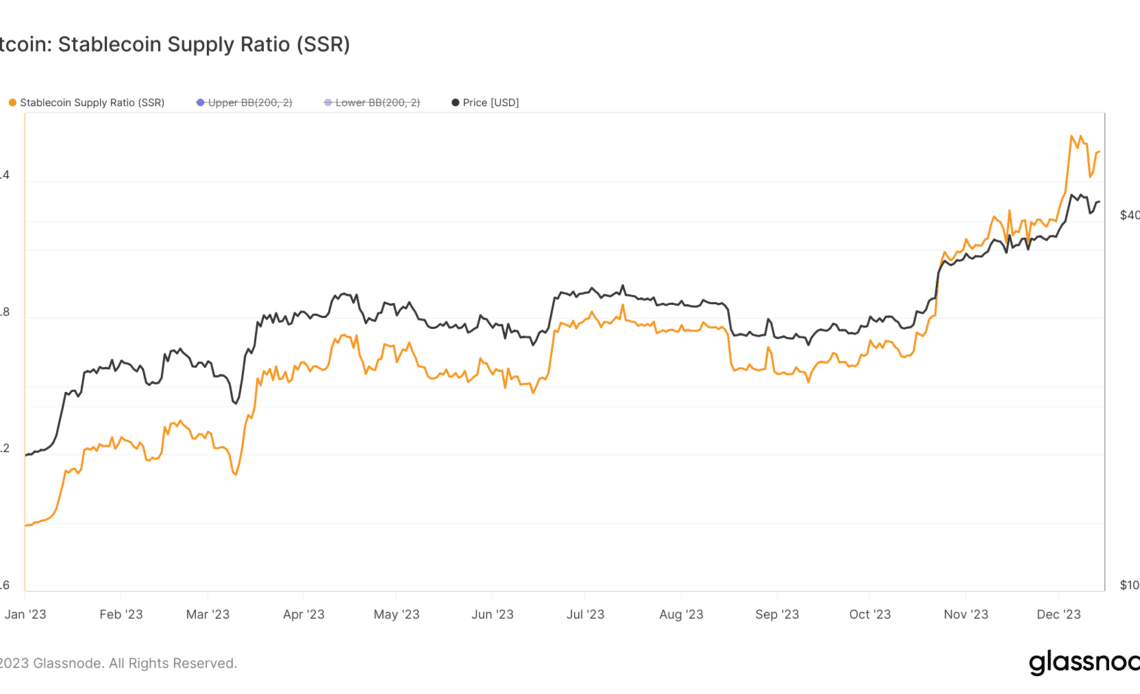
This year, the Stablecoin Supply Ratio (SSR) has shown significant trends, offering deep insights into Bitcoin’s market behavior. The SSR, calculated by dividing Bitcoin’s market cap by the market cap of major stablecoins, is a barometer for the relative financial strength and purchasing power of stablecoins against Bitcoin.
This year, a marked increase in SSR has been observed, with the ratio climbing from 2.36 on Jan. 1 to 6.74 by Dec. 14. This rise indicates a growing market cap of Bitcoin relative to stablecoins, hinting at shifts in market liquidity and investor preference.
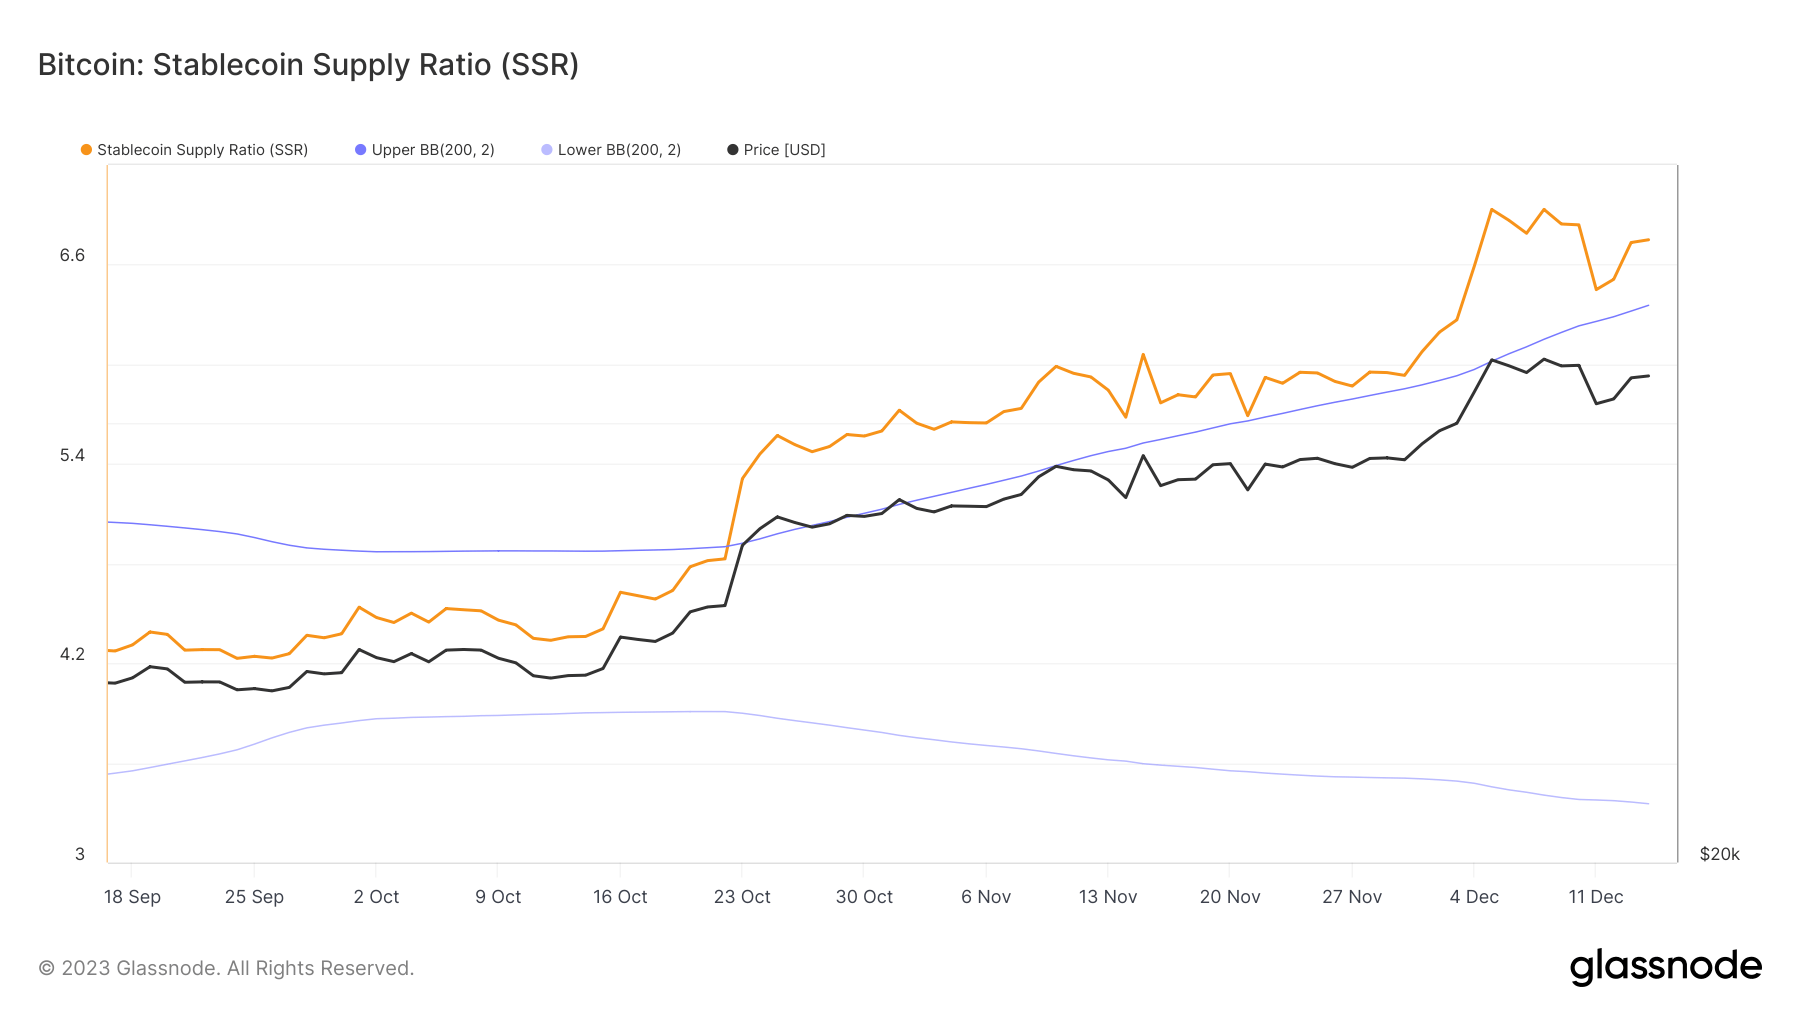
To fully understand these trends, it’s crucial to examine the SSR in relation to Bollinger Bands. Bollinger Bands are a set of trend lines plotted two standard deviations (positively and negatively) away from a simple moving average (SMA) of a particular asset or metric. They help identify the degree of volatility in the market. When the SSR crossed the upper Bollinger Band at 4.90 on Oct. 23 and remained above it, it signaled an unusual market condition: Bitcoin’s market cap grew significantly compared to stablecoins, indicating a potential shift in investor behavior or market sentiment.
A record high SSR of 6.93 on Dec. 8 further underscores this trend, though the subsequent slight decrease following Bitcoin’s price dip from $44,200 to $41,200 shows that as Bitcoin’s price fluctuates, the relative strength and impact of stablecoins on the market adjust accordingly, influencing the SSR.
The Stablecoin Oscillator, a derivative of the SSR, tracks how the 200-day SMA of the SSR moves within its Bollinger Bands, providing a more nuanced view of market trends. Between Dec. 8 and Dec. 14, the oscillator fell from 3.13 to 2.52 as Bitcoin’s price dropped and partially recovered. This shows a balancing act between Bitcoin’s direct market performance and the comparative value and utility of stablecoins. As Bitcoin’s price changes, it influences the SSR, which in turn affects the oscillator, highlighting the continuous and complex relationship between these two crucial aspects of the cryptocurrency market.
The year-to-date (YTD) high for the oscillator was marked on Oct. 25, reaching 4.13, contrasting with a YTD low of -1 at the beginning of the year. The oscillator’s YTD high and low…
Click Here to Read the Full Original Article at Bitcoin (BTC) News | CryptoSlate…


