Avalanche had performed well over the past week, however, the coin depreciated significantly over the last 24 hours. It shed close to 12% over the past day. AVAX experienced tough resistance at the $21 mark, and it was unable to break over it causing price of the asset to slump further.
Bitcoin and other major market movers has been struggling to trade above their immediate resistance mark too. BTC has been stuck at the $20,000 mark over the last few days. Broader market weakness has caused most altcoins to drop on their charts.
Currently, most prominent altcoins including AVAX has been witnessing a wave of selling pressure. With mounting selling pressure, AVAX might move closer to the immediate support level of $14 over the next trading sessions.
Since, the coin bounced from the $20 price level, AVAX has ever since continued to move south on its 24 hour chart. The global cryptocurrency market cap today is $892 Billion with a fall of 5.1% over the last 24 hours.
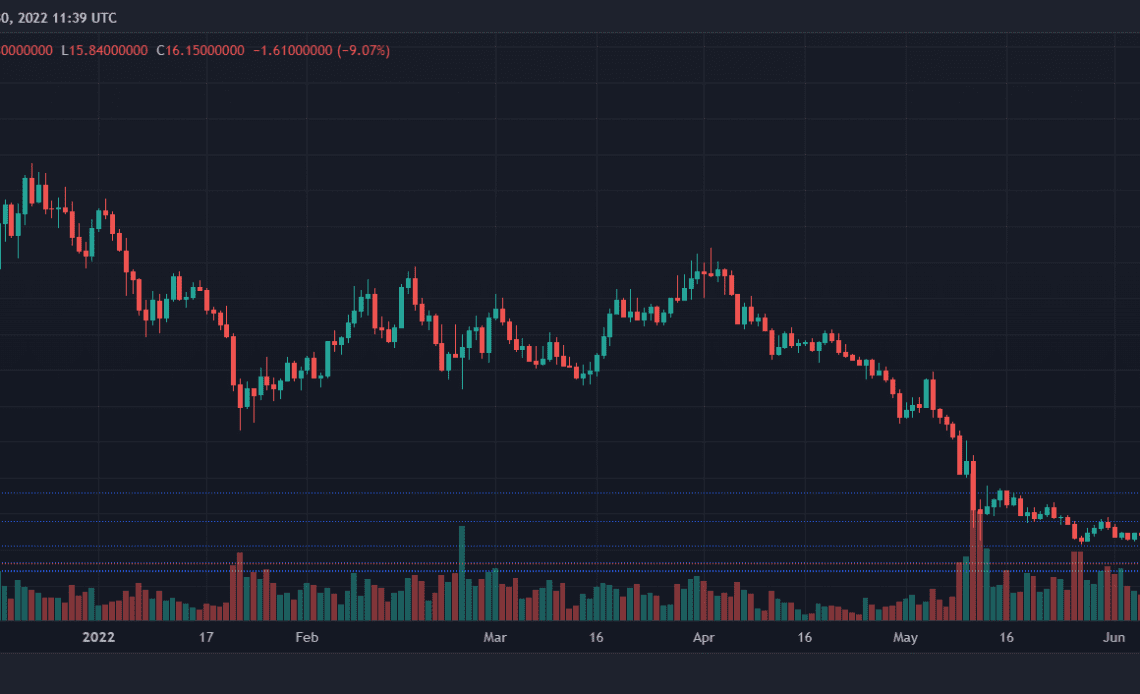
Avalanche Price Analysis: One Day Chart
AVAX was exchanging hands at $16 on the 24 hour chart. After being rejected at the $20 level, the coin continued to move on the bearish trend. The next support line for the coin was at $14. If the coin is unable to sustain above the $14 mark, it could trade near the $13 mark.
Overhead resistance was at $21, despite AVAX trying to break past it, the coin has failed multiple times causing the bears to gain strength. The volume of AVAX traded declined on the chart and the volume bar was in red which signified selling pressure and bearishness.
Technical Analysis
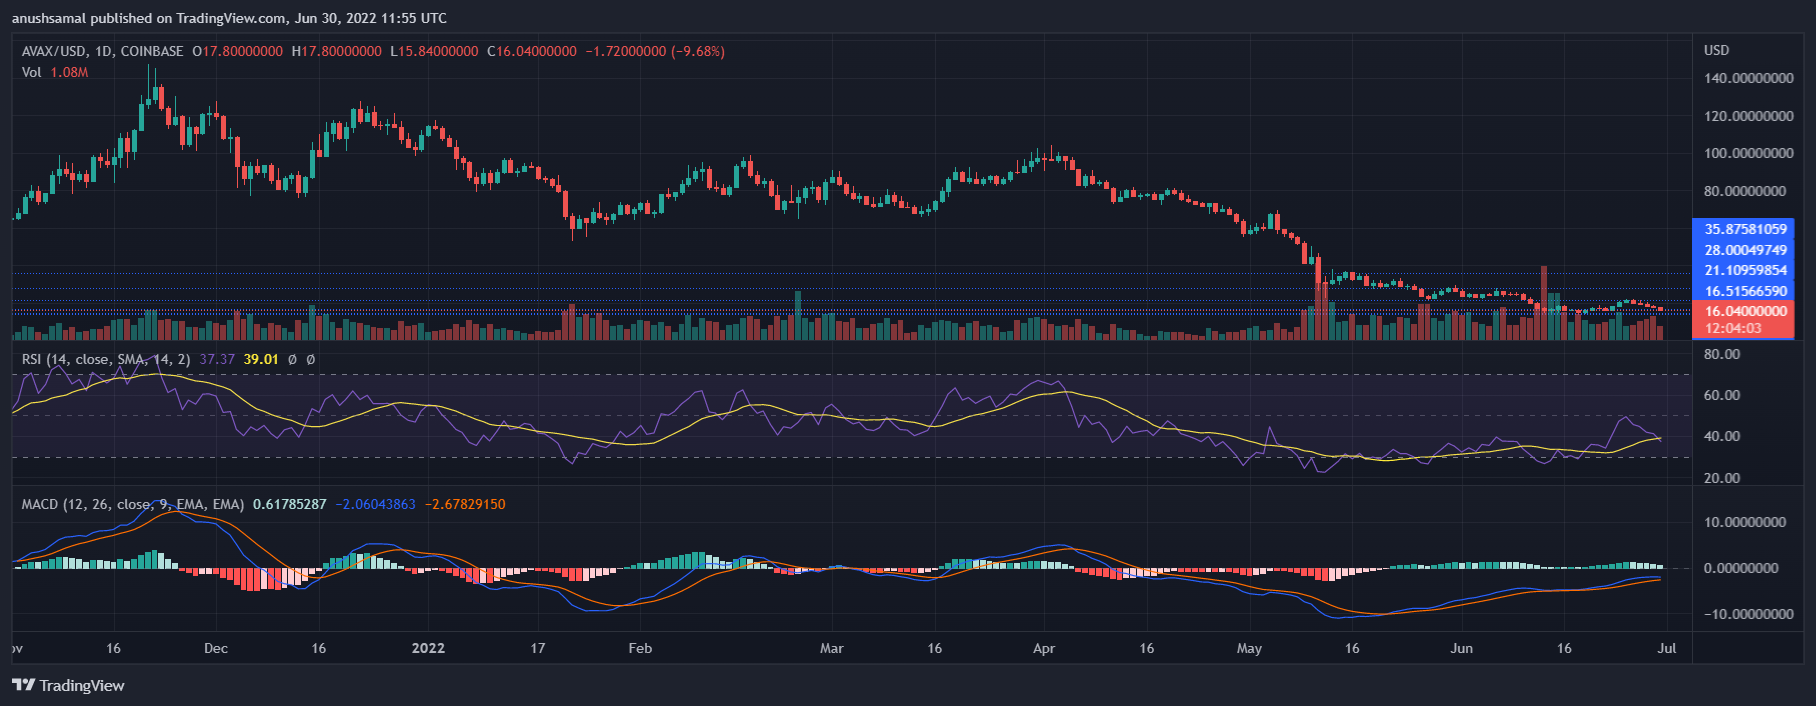
AVAX has barely registered buying strength over the past month. Over the last few days even though the coin registered some buying strength recovery, the current price drop invalidated the same. The Relative Strength Index was below the half-line for whole of this month, with occasional dip into the oversold region.
At press time RSI again noted a downtick suggesting continuation of a downtrend. Conversely, Moving Average Convergence Divergence flashed green signal bars. The indicator depicts the current price direction and possibility of price reversals too.
The green signal bars on the MACD are considered to be a buy signal and this presents a buying opportunity. If buyers act on it, AVAX might experience some relief.
Click Here to Read the Full Original Article at NewsBTC…


