Bitcoin (BTC) has been consolidating inside the $18,000–$20,000 price range since mid-June, pausing a strong bear market that began after the price peaked at $69,000 in November 2021.
Many analysts have looked at Bitcoin’s sideways trend as a sign of a potential market bottom, drawing comparisons from the cryptocurrency’s previous bear markets that show similar price behaviors preceding sharp bullish reversals.
Here are three strikingly similar trends that preceded past market bottoms.
2018’s sideways trend for BTC price
The 2018’s Bitcoin bear market serves as a major cue for a potential market bottom in 2022 if one looks at its eerily similar price trends and indicators.
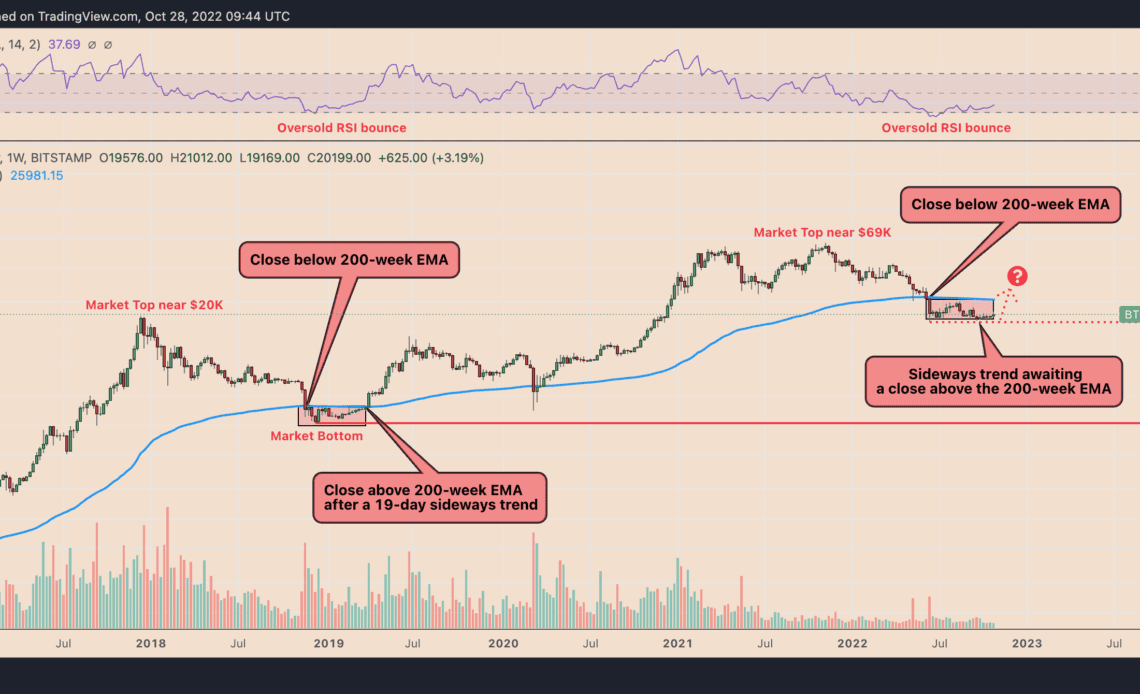
One of the key indicators is Bitcoin’s 200-week exponential moving average (200-week EMA; the blue wave in the chart below). In 2018 and 2022, Bitcoin entered a long period of sideways consolidation after closing below its 200-week EMA.
Except in 2018, Bitcoin’s sideways trend lasted for 11 days, with the price reclaiming its 200-week EMA as support, followed by moves toward approximately $14,000 in June 2019. In 2022, the sideways trend entered its 19th day on Oct. 28 but awaits a clear breakout above the 200-week EMA near $26,000.
Additionally, Bitcoin’s weekly relative strength index (RSI) hints at a potential bottom formation. In 2018, the RSI’s drop into its oversold territory (below 30) was followed by the BTC’s price sideways trend and eventually by a fully-fledged bullish reversal.
That is halfway similar to Bitcoin’s RSI trend in 2022, given it slipped below 30 in June and followed up with Bitcoin’s sideways price action between $18,000 and $20,000 levels. That could follow up with a bullish reversal phase if the 2018 fractal is repeated.
2013–2015 bull trap support
Bitcoin’s 2022 bear market also shares similarities to the price trends witnessed in 2013–2015, comprising a descending trendline resistance, a weak bull trap support trendline and a horizontal support level.
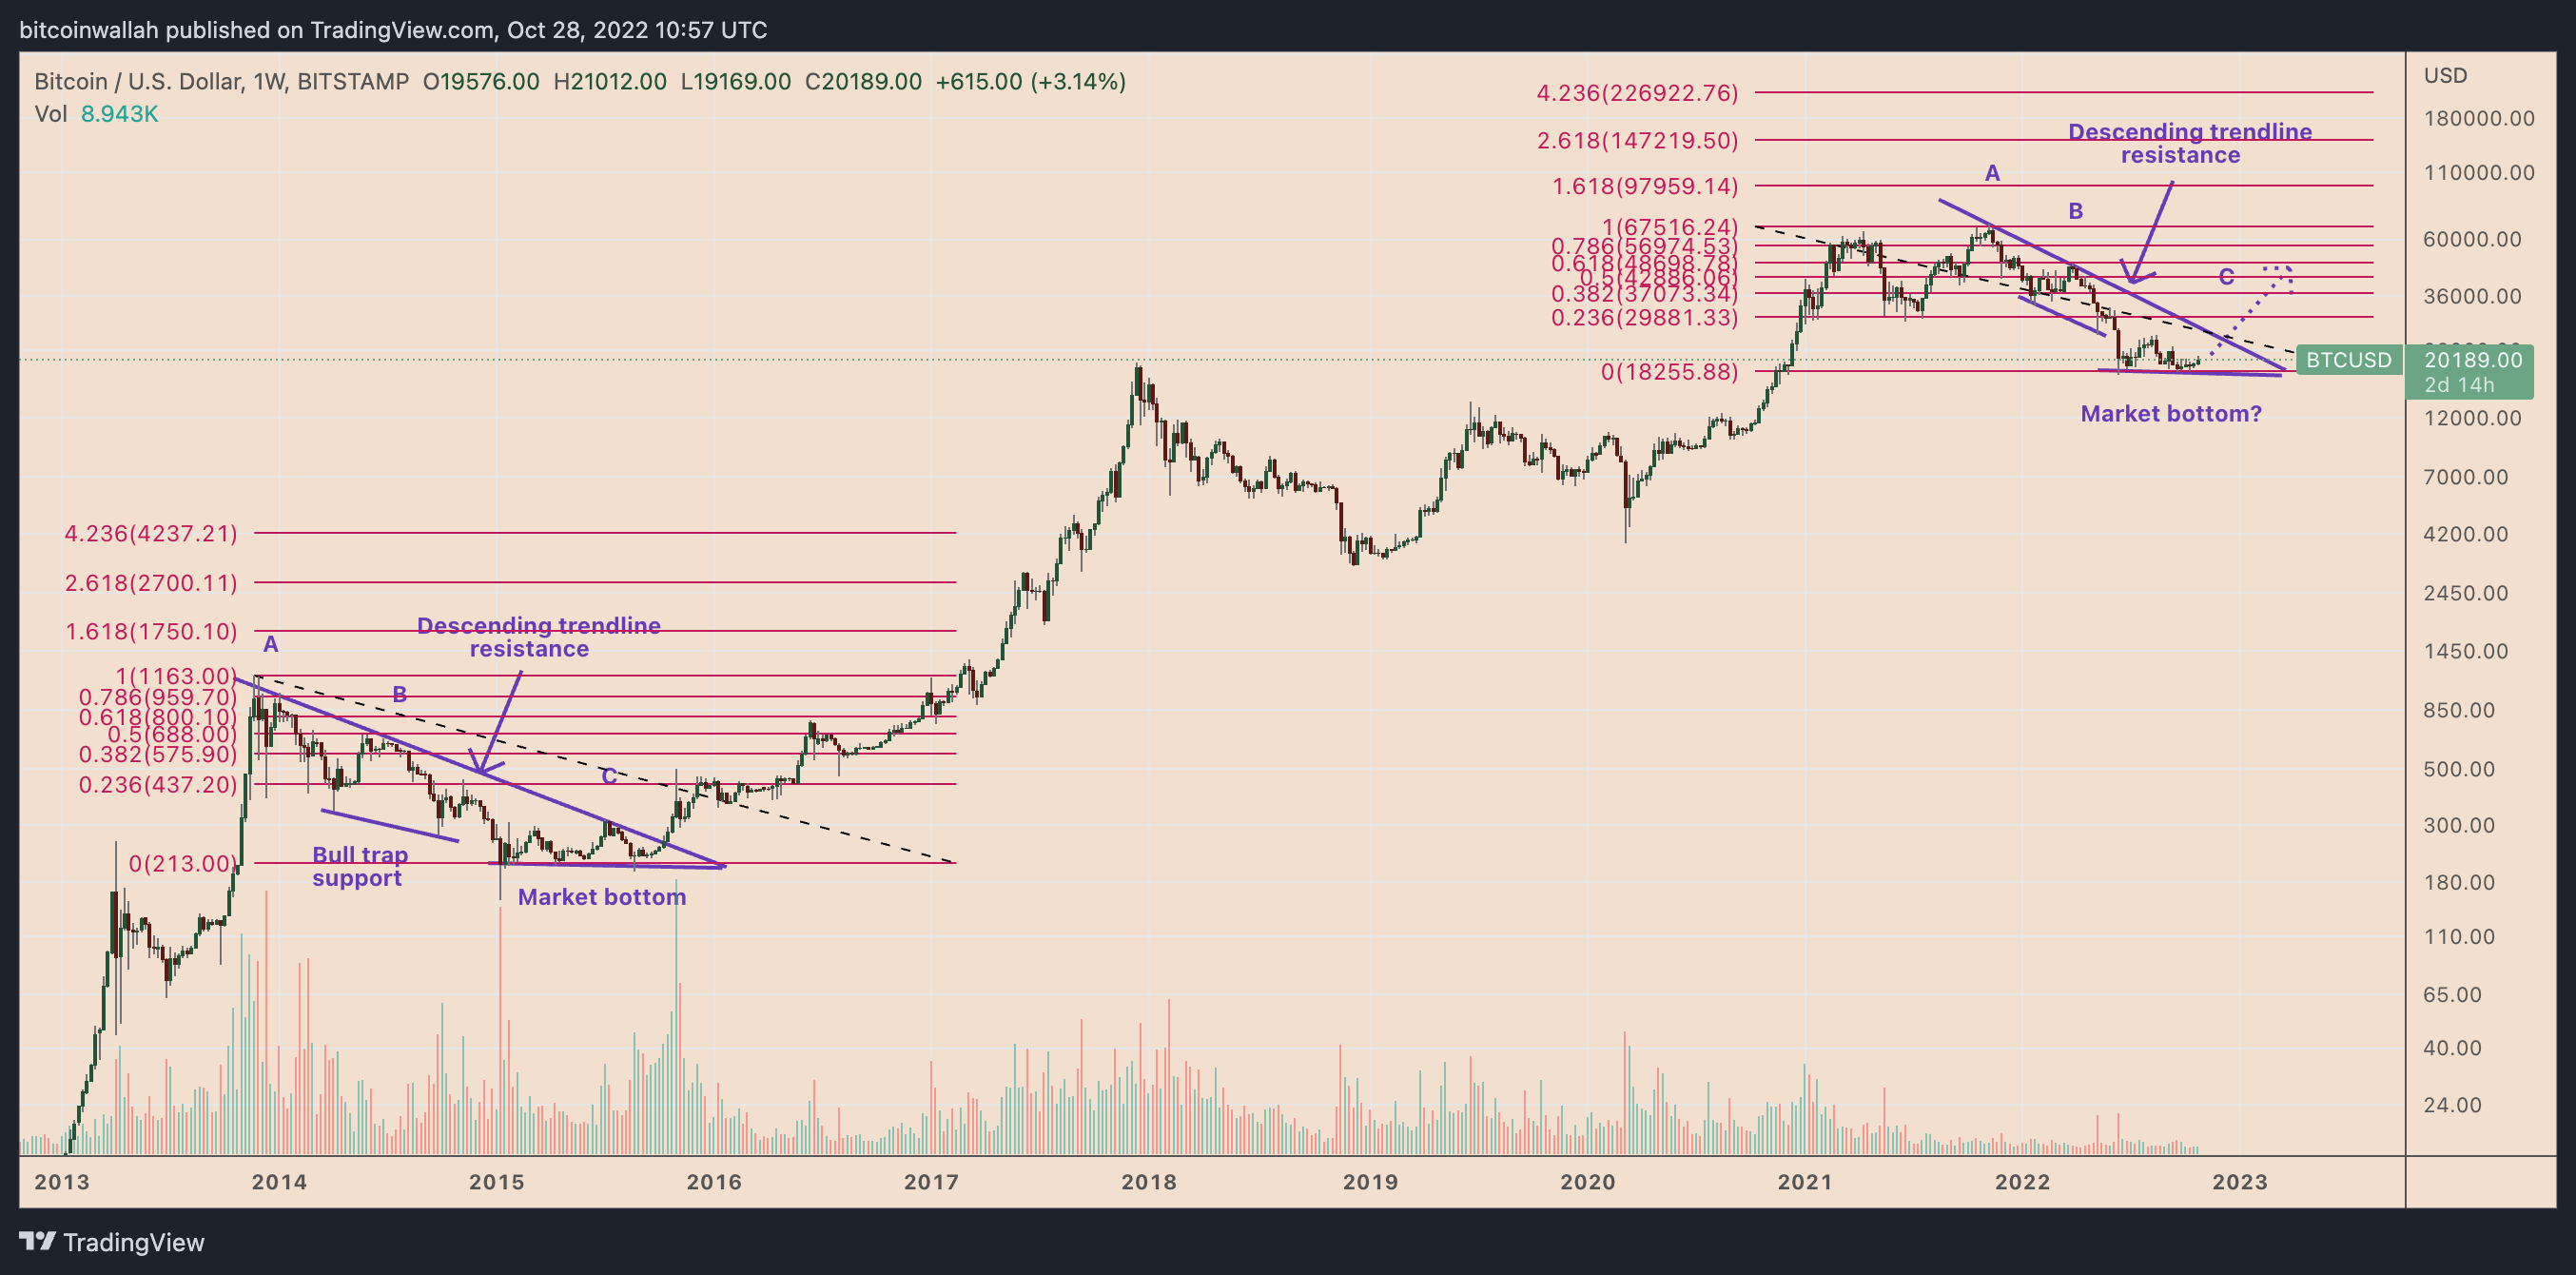
BTC’s price dropped 82% from its December 2013 top of around $1,200.
In doing so, Bitcoin attempted to close thrice above its descending trendline resistance (marked with A, B and C in the chart above). Simultaneously, the price drew limited support from another descending trendline, resulting in bull trap…
Click Here to Read the Full Original Article at Cointelegraph.com News…


