XRP is one of the top performers within the top 100 cryptocurrencies by market capitalization in the past 24 hours. With a price increase of 7%, the XRP price is showing significant bullish momentum, which could continue to expand according to various crypto analysts.
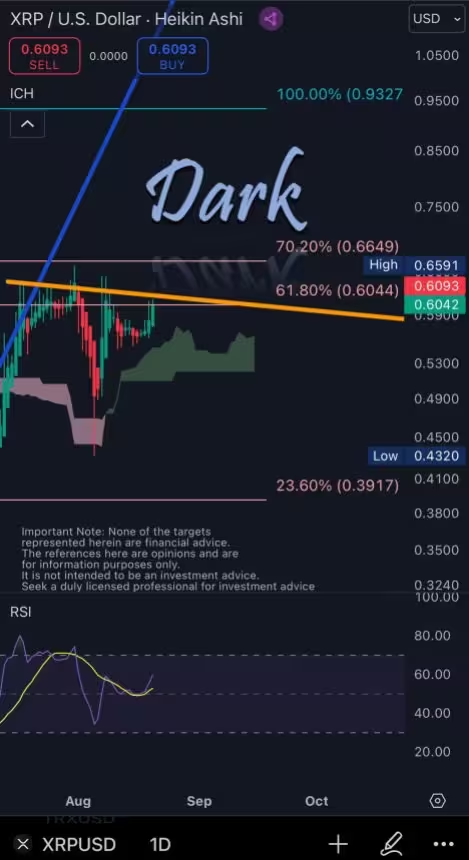
Dark Defender (@DefendDark) released a new technical analysis of the XRP/USD pair today that shows a strong bullish trend. According to his latest post on X, “XRP touched the fibonacci zone of 61.80% at $0.6044 & trying to break here. Heikin Ashi candles are bullish & Green. RSI has golden cross & Green. Ichimoku Clouds are Green. Shortly we expect to touch $0.6649 then $0.9327!” This statement is loaded with technical insights and predictions.
#1 XRP About To Break Key Fibonacci Levels
Starting with the Fibonacci retracement levels, a popular tool among traders for identifying potential reversal levels, the price of XRP touching and attempting to breach the 61.80% retracement level at $0.6044 is significant. This level often acts as a major resistance or support level, depending on the direction of the approach.
For XRP, this level is crucial as the price has rebounded from recent lows and is testing this crucial threshold that could confirm the continuation of the upward trend. If XRP closes above $0.6044 on the daily chart, $0.6649 (70.20%) and then $0.9327 (100%) could be next targets, according to Dark Defender.
#2 Bullish Heikin Ashi Candles
The mention of “Heikin Ashi candles are bullish & Green” indicates that the recent price action has been dominantly bullish, characterized by green Heikin Ashi candlesticks. These candlesticks differ from traditional ones as they are derived from average price movements, thus they help traders identify trends more clearly and make decisions based on less noisy data.
#3 RSI Golden Cross
Another important aspect Dark Defender highlights is the “RSI has golden cross & Green.” The Relative Strength Index (RSI) is a momentum oscillator that measures the speed and change of price movements on a scale of zero to 100. Typically, an RSI reading above 70 indicates a market in overbought conditions, while below 30 suggests oversold conditions.
The RSI line has crossed above its moving average, creating what is known as a ‘golden cross.’ This is typically a bullish signal, suggesting that the momentum is shifting towards the buying side. The RSI is currently trending upwards, staying within the neutral territory, indicating there is room for upward…
Click Here to Read the Full Original Article at NewsBTC…


