XRP has emerged as a standout performer among the top-100 cryptocurrencies by market capitalization today, recording a substantial 7% increase over the past 24 hours. This surge in XRP’s price occurs amidst swirling speculations of a forthcoming settlement or remedies ruling in the Ripple-SEC case.
Amid these developments, XRP is dominating discussions on X (formerly Twitter), where a flurry of optimistic posts paint a bullish scenario for the cryptocurrency. Among the vocal proponents contributing to this positive outlook is crypto analyst Doctor Magic (@Doctor_Magic_), who shared several different time frame analyses for XRP.
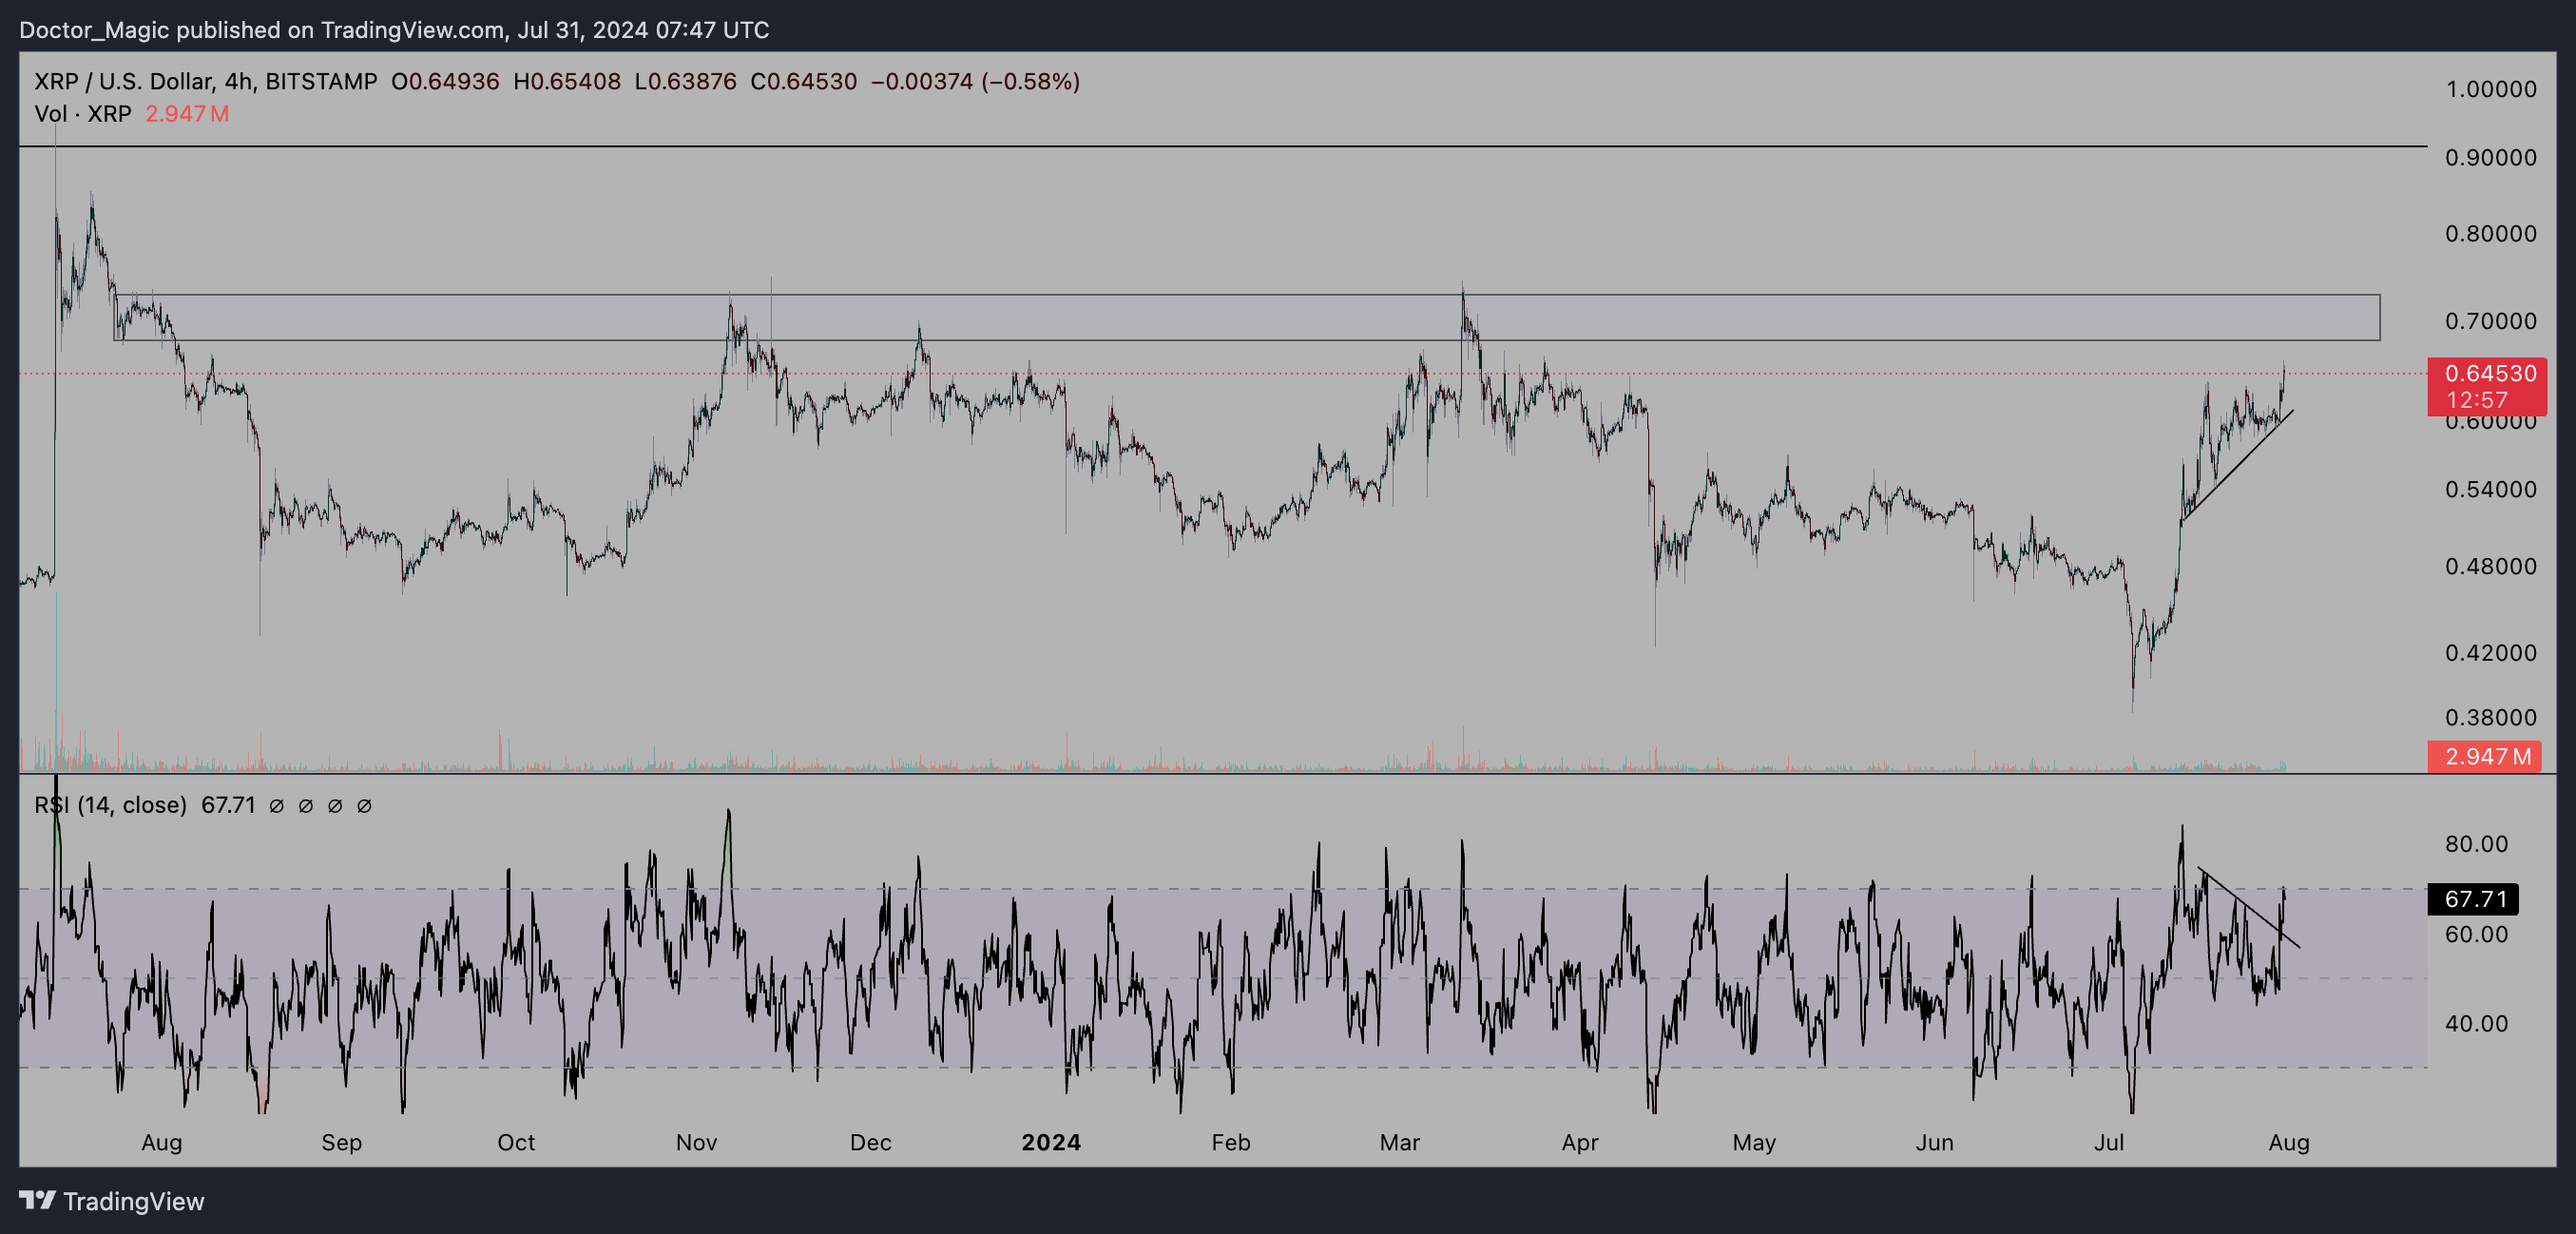
Short-Term Outlook For XRP (4-Hour Chart)
The first chart posted by the crypto analyst shows the XRP/USD trading pair on a 4-hour time frame. The chart highlights the currently most crucial resistance zone (in red) just above the $0.70 mark. This resistance level is critical, as Doctor Magic suggests that surpassing this could pivot XRP towards new all-time highs (ATHs).
Related Reading
However, he warns of potential short-term (LTF) rejections despite the higher time frame (HTF) indicators appearing bullish, advising traders to exercise caution with leverage long positions in this zone. “XRP most heavy resistance, get above that and we go for ATHs. Note that even though HTF XRP is primed on LTF this resistance could cause a LTF rejection, wouldn’t jump into leverage longs here.”
The chart shows an uptrend line that XRP has successfully maintained, suggesting a strong bullish momentum. The focal point is the resistance zone above $0.70, which if breached, could potentially lead to higher price levels. The first target could be the price level above $0.90 which was last seen after the summary judgment by Analisa Torres on July 13 last year.
A crucial element in Doctor Magic’s analysis is the breakout observed in the Relative Strength Index (RSI). The RSI demonstrates a clear upward breach of its previous trendline, signaling robust momentum. Currently at 67, the RSI is approaching the overbought threshold, which could suggest some notably bullish days ahead for XRP’s price action if the cryptocurrency runs red hot.
Related Reading
Notably, the $0.70 zone as the key resistance area aligns with the Bollinger Bands analysis in the monthly chart. XRP surged above the middle band with the latest move and is now on the verge of breaking the…
Click Here to Read the Full Original Article at NewsBTC…


