Last week, when the June monthly candle came to a close in Bitcoin, it also signaled the end to the second quarter of the year and its first half. The top cryptocurrency suffered its worst quarterly decline since 2011, but it ultimately held above a key support level.
Here is a closer look at the quarterly support level currently holding in BTCUSD and how it has put in nearly ever major bottom in the past.
Bitcoin Crash Falls To Level Where Bear Markets Bottom
Throughout the 2018 bear market, a primary narrative giving hope to bag holders, was the fact that institutions would eventually get into Bitcoin and it would make all the difference. Institutions did find their way into crypto eventually, leaving many of them at risk of insolvency.
Larger institutions are known to take positions by quarter, and with two abysmal quarters in a row of performance in crypto, institutions could be ready to get back in.
Related Reading | Bitcoin Monthly Tags Lower Bollinger Band, Tool’s Creator Hints At Bottom
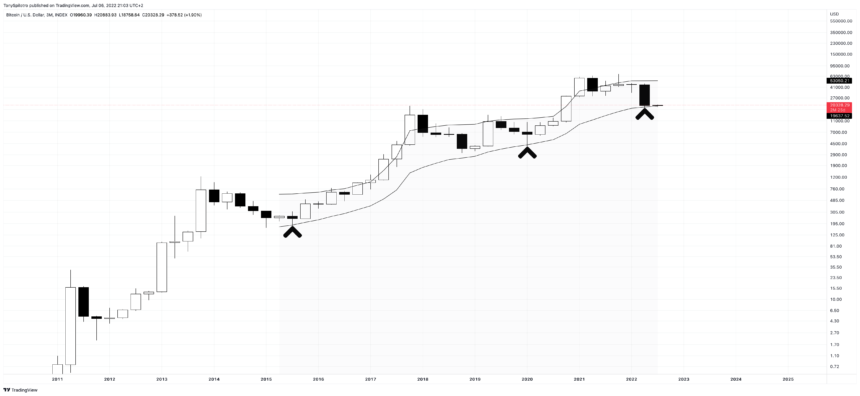
The recent selloff took Bitcoin price a lot lower than many would have expected – to the tune of more than 50%, making it the worst quarterly close in a decade. It also landed dead smack on the middle-Bollinger Band.
BTCUSD quarterly closes above the middle-SMA | Source: BTCUSD on TradingView.com
How To Read The Bollinger Bands And What Comes Next
The Bollinger Bands are a volatility measuring tool, designed by John Bollinger in the 1980s. The middle-Bollinger Band is a 20-period moving average, with the upper and lower bands set at 2 standard deviations.
Based on statistics, most price action takes place within the upper and lower bands. Passing above or below the SMA is considered a buy or sell signal.
Each bear market in the past has touched down on this same SMA ahead of the 2016 and 2017 bull run, and then again ahead of the 2020 bull run. Bitcoin price is back at this line again, touching it for the second quarter in a row.

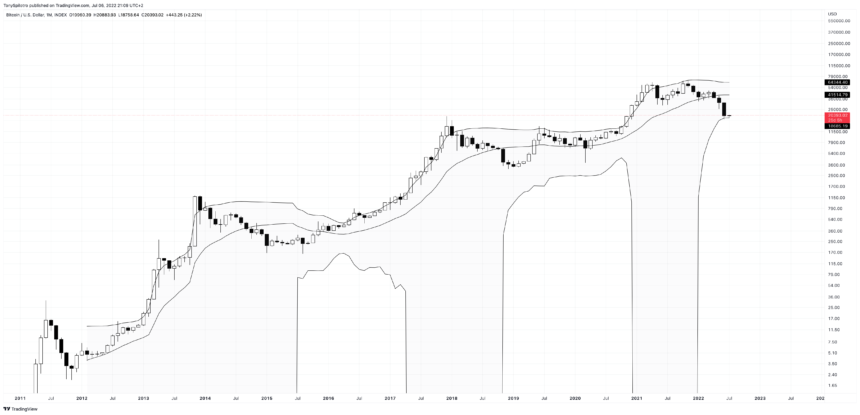
BTCUSD monthly touches down on the lower Bollinger Band | Source: BTCUSD on TradingView.com
Falling through the SMA would be unprecedented in the history of Bitcoin. But Bitcoin has been doing unprecedented things recently. For example, the same tool above shows the first ever touch of the lower Bollinger Band on monthly timeframes.
Related Reading | Bitcoin Weekly RSI Sets Record For Most Oversold In History, What Comes Next?
In theory, price is considered low relative to the history of the asset when prices are at the lower end…
Click Here to Read the Full Original Article at NewsBTC…


