Polygon (MATIC), the high-speed scaling solution for Ethereum, has been on a rollercoaster ride this month. After a brutal price correction that saw MATIC tumble over 20%, a recent 24-hour surge has injected a dose of optimism into the market. But is this a sign of a full recovery, or a temporary reprieve before further decline?
Polygon’s Price Plunge: A Reality Check
CoinMarketCap data paints a sobering picture. MATIC has been steadily dropping down the ranks of the top 20 cryptocurrencies, currently sitting at number 18. This decline coincides with a significant price drop, with MATIC losing over a quarter of its value in the last 30 days.
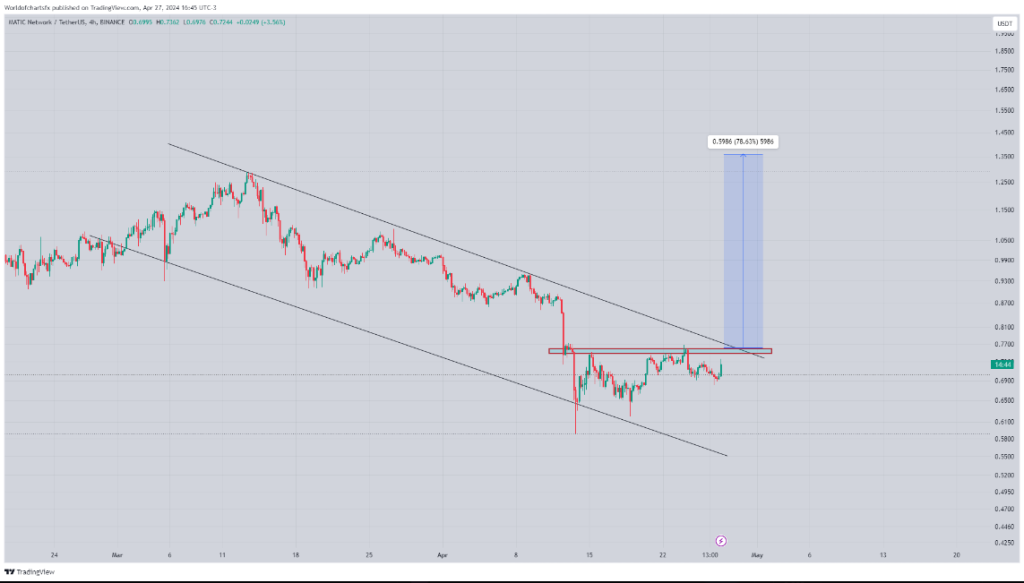
Analysts like World of Charts point to the descending channel pattern on MATIC’s daily chart, a classic indicator of a bearish trend. For a true price recovery, MATIC needs to overcome a crucial hurdle: the $0.77 resistance level. A breakout above this point could trigger a significant bull run to the $1 dollar level, but the climb won’t be easy.
$Matic#Matic Still Nothing Has Changed Consolidating In Descending Channel Successful Breakout Can Lead Massive Bullish Wave In Coming Days https://t.co/RBiSg4kaGb pic.twitter.com/fUwIbyW2hA
— World Of Charts (@WorldOfCharts1) April 27, 2024
Pulse On Investor Sentiment
The past 24 hours have offered a glimmer of hope for Polygon bulls. The token price surged by 5%, briefly eclipsing the $0.74 mark. This uptick coincides with an improvement in the MVRV ratio, which suggests a rise in the number of profitable MATIC investors.
Additionally, the bullish crossover on the MACD indicator hints at a potential increase in buying pressure. However, beneath the surface, some concerning trends remain.
MATIC market cap currently at $6.8 billion. Chart: TradingView.com
Despite the recent price uptick, data suggests substantial selling pressure on Polygon. The exchange inflow has increased significantly, indicating investors moving tokens onto exchanges, often a precursor to selling. This trend is further corroborated by a rise in MATIC’s supply on exchanges, while the supply held outside of exchanges has dwindled.
Technical Indicators Paint A Mixed Picture
While the MACD offers a glimmer of hope, other technical indicators remain bearish. The Bollinger Bands suggest reduced volatility, which can be a sign of consolidation before a breakout or a further price drop. Both the Money Flow Index (MFI) and Chaikin Money Flow (CMF) have registered…
Click Here to Read the Full Original Article at NewsBTC…


