Solana (SOL) has recently pulled back to the $137 level, a key point that could dictate its next move in the market. As the cryptocurrency tests this resistance, market participants are watching closely to see if the bears will seize the opportunity to drive prices lower, or if the bulls will capitalize on this pullback to ignite a breakout.
This article aims to analyze Solana’s recent pullback to the $137 level and assess whether the bears can regain momentum to push the price lower or if the bulls will leverage this moment to drive a breakout. By examining key technical indicators, market sentiment, and potential scenarios, we aim to provide traders and investors with a comprehensive outlook on SOL’s next potential moves and what to watch for in this crucial phase.
Currently, Solana is trading at approximately $135, reflecting a 4.66% increase. The cryptocurrency boasts a market capitalization of over $63 billion, with a trading volume surpassing $2 billion. Over the past 24 hours, Solana’s market cap has grown by 4.70%, while its trading volume has dipped by 6.89%.
Market Overview: SOL’s Recent Movement To $137
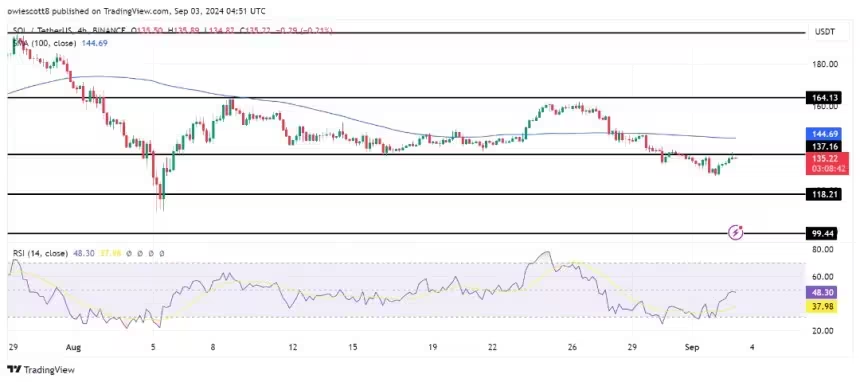
On the 4-hour chart, Solana has gained significant bullish momentum, advancing toward the $135 mark and forming multiple positive candlesticks just below the 100-day Simple Moving Average (SMA). This upward movement suggests increasing buying interest. However, the proximity to the 100-day SMA indicates that the bulls will need to maintain their momentum to overcome this resistance and push higher.
Additionally, on the 4-hour chart, the Relative Strength Index (RSI) has climbed to 48% after rebounding from the oversold zone and is now attempting to move above the 50% mark. This upward shift in the RSI indicates strengthening buying pressure, which could support further positive movement if it continues.
On the daily chart, Solana is showing signs of a bullish attempt toward the $137 level, remaining below the 100-day SMA. A bullish momentum candlestick was formed in the previous trading session, suggesting potential upward movement despite its current position below the key moving average.
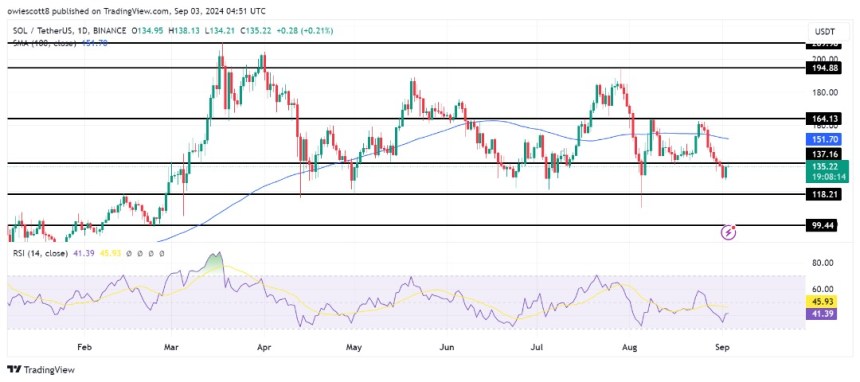
Finally, the 1-day RSI suggests that Solana might extend its current pullback. The signal line, which had…
Click Here to Read the Full Original Article at NewsBTC…


