A golden cross pattern on the charts excites crypto traders for its promises of profitable opportunities ahead, largely due to its impressive success rate in traditional markets.
The golden cross tends to preceded sustained uptrends in contrast with the bearish death cross pattern. For instance, since 1970, the S&P 500 has been returning about 15% gains on average in less than a year after a golden cross’s occurrence.
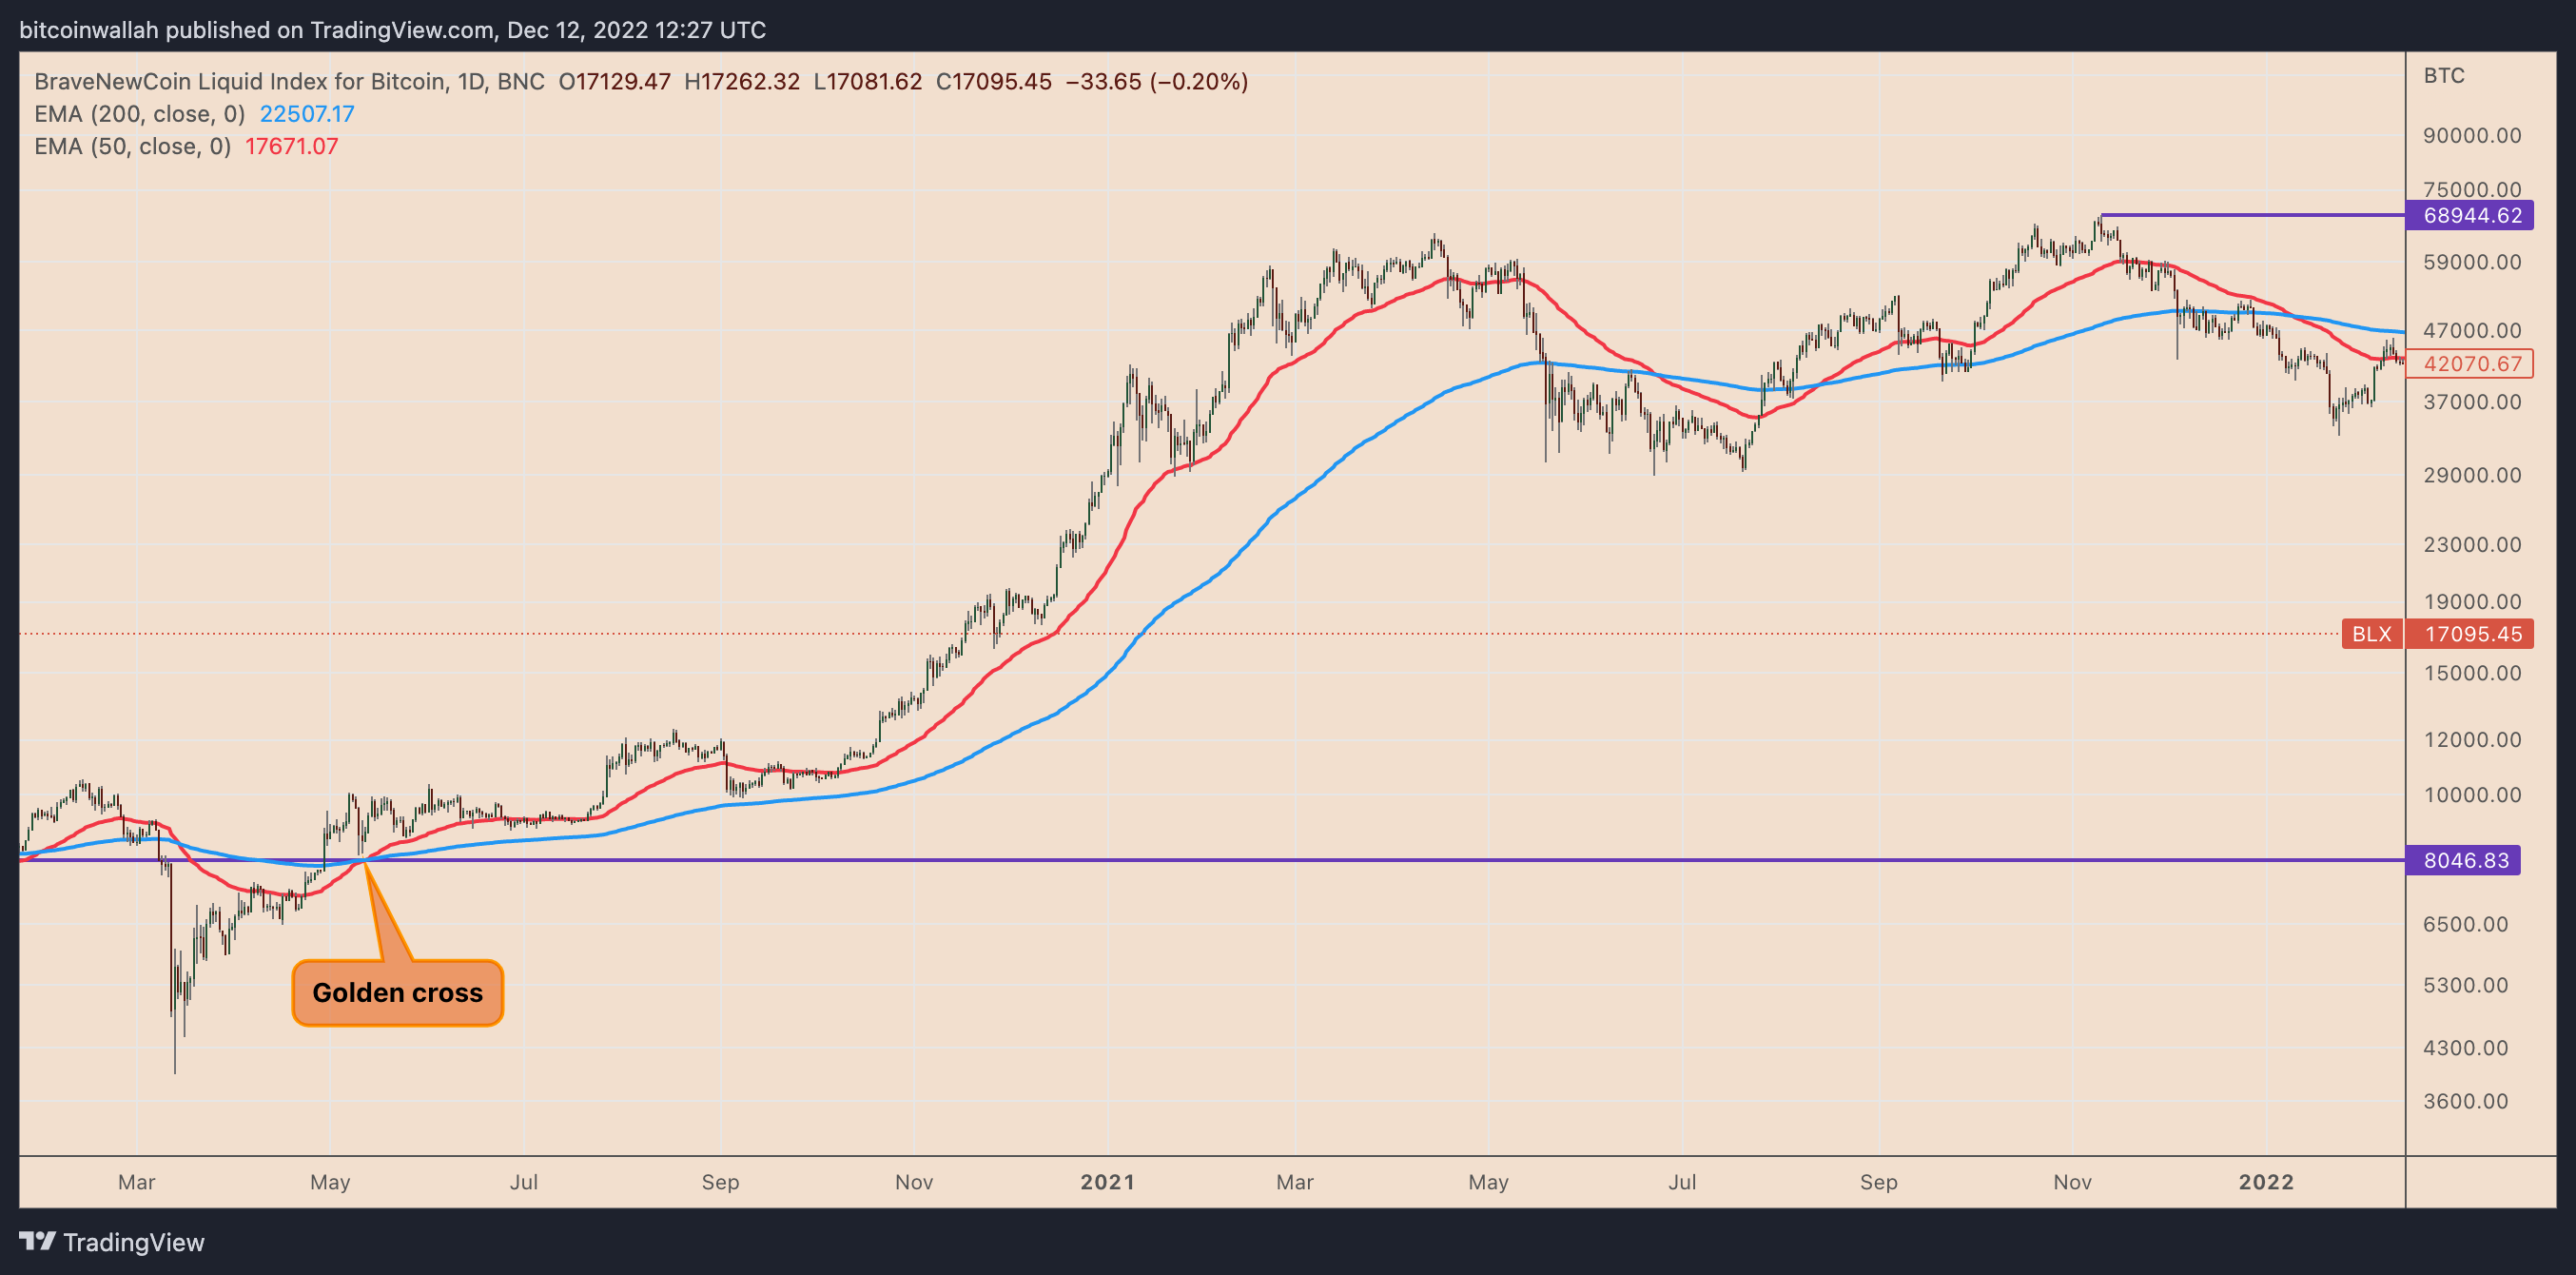
The golden cross’s record in the benchmark crypto asset Bitcoin (BTC) is similarly impressive. Notably, the indicator has appeared seven times on Bitcoin daily charts since 2010, out of which five have led to massive bull runs.
What is a golden cross pattern?
Before discussing the golden cross, let’s discuss its core component known as moving averages (MA).
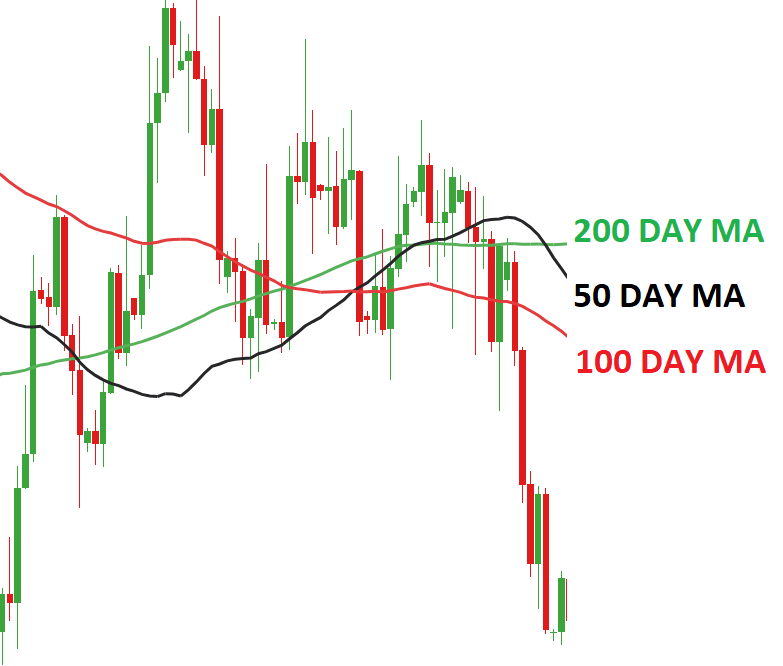
A moving average records the average change in an asset’s price over a specific period. Mathematically, they are measured after adding a set of prices (recorded in a fixed timeframe such as hourly, four-hour, daily, weekly, monthly, etc.) — and by dividing the sum by the number of prices in the set.
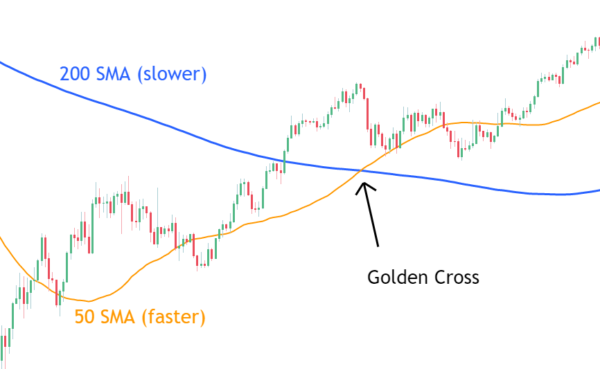
Traditionally, golden cross watchers focus on two specific moving averages: the 50-day moving average, which becomes the short-term MA, and the 200-day MA as the long-term moving average.
A golden cross pattern forms when the short-term MA crosses above the long-term MA. In other words, the pattern shows that buying interest in a particular market has risen over the previous 50 days, compared to the previous 200 days.
How does a golden cross work?
Golden crosses typically precede significant price rallies across traditional and crypto markets, a reason why traders perceive them as buy signals.
But there have been cases where golden crosses have been followed by fake breakouts. Therefore, one should consider the golden cross pattern alongside other technical indicators before making a decision.
For starters, traders can employ the relative strength index (RSI), a momentum oscillator that determines an asset’s overbought and oversold conditions, to predict potential price pullbacks.
Related: What is a Doji candle pattern and how to trade with it?
In February 2020, this strategy may have helped many traders avoid deeper losses. Let’s see why.
On Feb. 1, 2020, Bitcoin’s 50- and 200-day MA formed a golden cross when it traded for around $9,500….
Click Here to Read the Full Original Article at Cointelegraph.com News…


