Any Bitcoin price prediction is just a guess without a basis to make the forecast. The stock-to-flow model that was once the most cited reason for expectations of higher prices has failed, leaving technical analysis, on-chain signals, and statistics as the best chance of finding future price targets.
Elliott Wave Theory is a technical analysis forecasting methodology discovered in the 1930s, which is based on identifying extremes in investor psychology combined with distinctive price behavior. With Bitcoin and other cryptocurrencies being so susceptible to the ebb and flow of investor sentiment, here is what Elliott Wave Theory suggests about what is to come for Bitcoin price.
A Brief History Of BTC Price Action
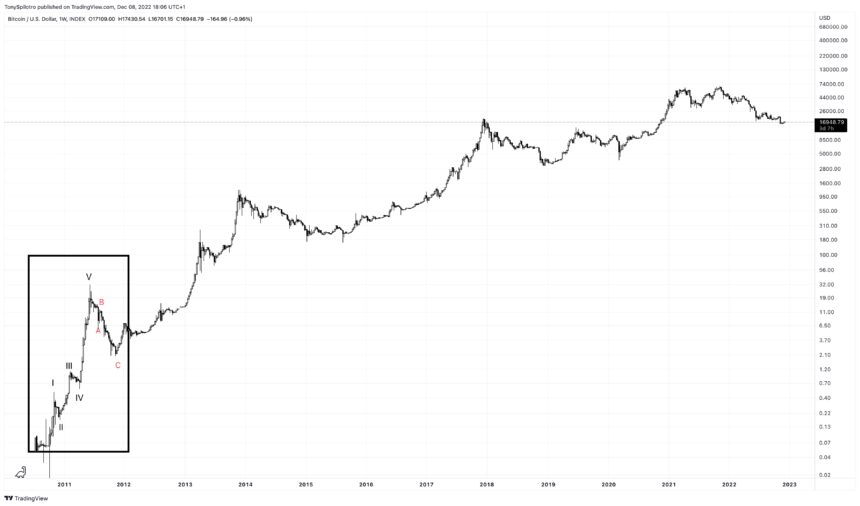
The Bitcoin price index chart begins in late 2010, with the first-ever cryptocurrency trading at only pennies on the dollar. By the end of 2011, the price per BTC grew by more than 60,000%. Before the year came to a close, it has lost 94% of its value.
From the low of approximately $2, another bullish impulse added yet another 60,000% ROI by the 2013 peak. Yet another steep corrective phase followed, cutting the cryptocurrency down by 86%.
What followed was arguably the most talked about bull run since the dot com bubble, when in 2017 Bitcoin reached nearly $20,000 per coin. By now, we can see that extreme price swings and pivots in investors sentiment lead to boom and bust cycles across crypto. Bitcoin once again found a bottom at $3,000 in 2018, which will be the basis of the remainder of the analysis.
The first wave ever and the history of Bitcoin price | Source: BTCUSD on TradingView.com
An Introduction To Elliott Wave Theory
First discovered by Ralph Nelson Elliott in the 1930s, Elliott Wave Theory is a basis for explaining how markets grow over time. The motive wave in EWT is an example of markets moving three steps forward, and two steps back.
These steps alternate back and forth between growth and corrective phases. Motive waves consist of five waves in total – with odd numbered waves moving in the direction of the primary trend, and even numbered waves moving against it.
Although corrective phases do result in a drastic decline in value, incremental growth always remains in the primary trend direction. Waves, both impulsive and corrective both appear in varying degrees and timescales.
For example, a five-wave impulse on the daily timeframe could only be a tiny portion of a multi-century Grand Supercycle. Figuring out where Bitcoin…
Click Here to Read the Full Original Article at NewsBTC…


