After a brief pullback, BONK is showing signs of renewed strength as bullish momentum begins to build. The recent price action indicates that bulls have regained control, pushing the token out of its recent slump.
As the market shifts, traders are now eyeing a potential upside breakout, with BONK’s next targets becoming increasingly clear. Could this be the beginning of a fresh rally, or will the bears attempt to reclaim their dominance once again?
In this article, we’ll provide an in-depth analysis of BONK’s recent price action following its pullback and explore the renewed bullish strength that has emerged. By examining key technical indicators, we’ll assess whether this shift in momentum signals the potential for further upside and a breakout, or if the token is likely to face resistance in the near term.
Technical Indicators: Signs Of Bullish Momentum Building
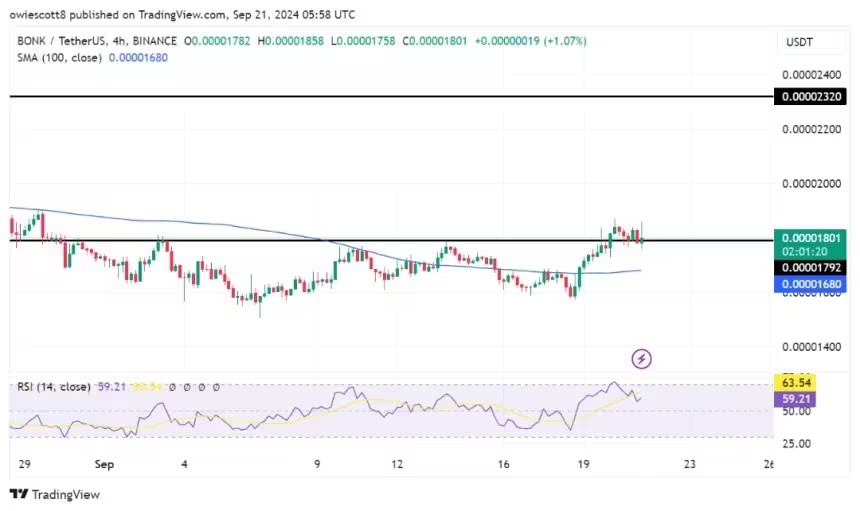
Recently, BONK’s price has turned bullish on the 4-hour chart, rebounding and moving above the $0.00001792 resistance level. The meme coin is trading above the 100-day Simple Moving Average (SMA) and is demonstrating strong momentum, with a current focus on moving toward the $0.00002962 level.
An analysis of the 4-hour Relative Strength Index (RSI) indicates that bulls may be poised to make a comeback. Although the RSI has decreased to 59% from the overbought zone, it remains above the 50% threshold, suggesting that bullish momentum is still present. This positioning indicates that while there has been some cooling off, the market retains the potential for upward movement as long as the RSI stays above this key level.
Related Reading
Also, on the daily chart, BONK is displaying positive momentum, evidenced by a rejection wick on the present daily candlestick. Despite being below the 100-day SMA, this rejection wick shows that buyers are stepping in and pushing the price higher, causing the selling pressure to diminish.
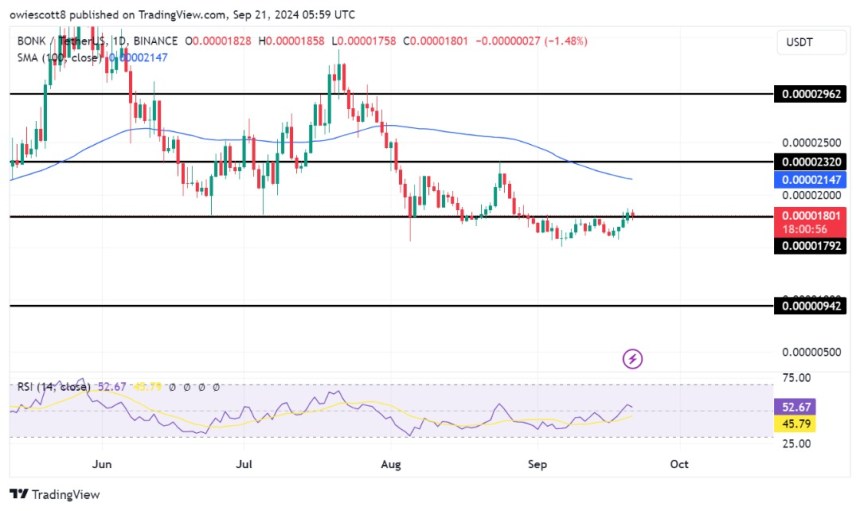
Finally, on the 1-day chart, a close look at the 1-day RSI formation suggests that BONK may fully resume its upward movement as the indicator’s signal line has climbed above the 50% threshold and is currently positioned at 53%.
Potential Upside Targets: Where Could BONK Be Headed Next?
As BONK…
Click Here to Read the Full Original Article at NewsBTC…


