The price of Bitcoin (BTC) has continued to struggle against Tether (USDT) as bulls and bears are caught in a tug of war regarding where Bitcoin price should be headed as we approach the monthly close. Bitcoin’s (BTC) price showed so much steam, but it seems like it was just a bull trap for many investors and traders. (Data from Binance)
Bitcoin (BTC) Price Analysis On The Weekly Chart
Bitcoin’s (BTC) price has shown so much strength trying to hold above $19,500 in the past few days, with the price bouncing immediately as it drops into the sub $19,800 on several occasions.
The price of BTC has continued to show strength, trying to break above $20,500 despite being rejected; the BTC price needs to break this area acting as resistance for bulls to have the chance of pushing the price higher to a region of $22,000.
BTC is currently trading below its resistance, stopping the price from trending higher; if BTC cannot break past this resistance of $20,800, we could see the price revisiting the support region at $19,000, acting as a demand zone for most investors.
Weekly resistance for the price of BTC – $20,800.
Weekly support for the price of BTC – $19,000.
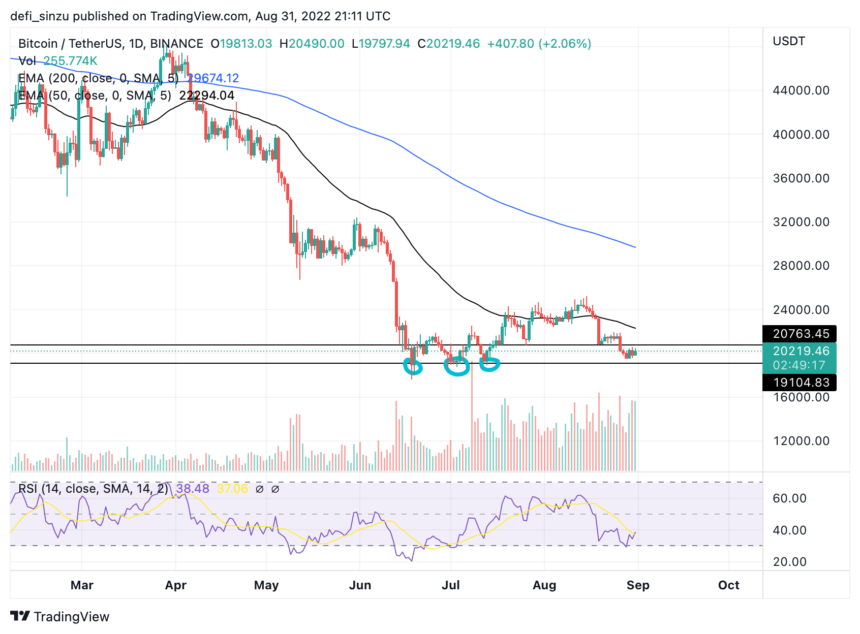
Price Analysis Of BTC On The Daily (1D) Chart
The price of BTC found its daily low at $19,500; as the price bounced off from that region, BTC’s price has remained strong, trading above $19,000, not allowing bears to take the price lower.
Despite being rejected recently from the $20,500 mark, BTC price has shown great bullish strength, not retesting the support region of $19,000 as this would favor bears.
The price of BTC is trading at $20,100 below the daily 50-day and 200-day Exponential Moving Average (EMA).
The 50 and 200 EMA correspond to prices of $22,200 and $30,000, respectively, acting as resistances for the price of BTC to trend higher. If the BTC price breaks and holds above the $22,200 corresponding to the 50 EMA, we could see the price trending higher to $23,000.
If BTC’s price fails to break above its resistances, then prices would find more momentum at its support of $19,000 or even lower.
Daily (1D) resistance for the BTC price – $22,200, $30,000.
Daily (1D) support for the BTC price – $19,000.
Price Analysis Of BTC On The Four-Hourly (4H) Chart
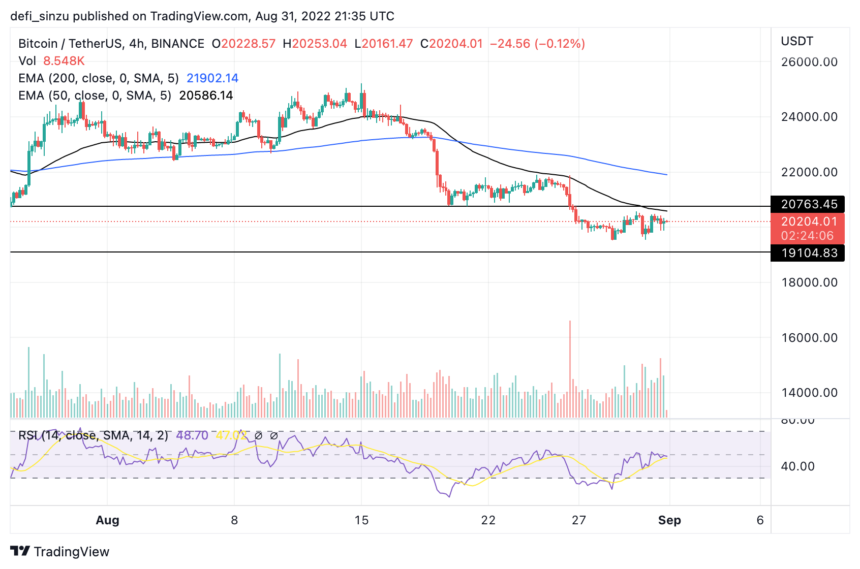
The price of BTC on the 4H chart has continued to look bearish, trying to hold above the support area at…
Click Here to Read the Full Original Article at NewsBTC…


