In his latest analysis, legendary trader John Bollinger has expressed concerns over Litecoin’s performance, particularly in comparison to Bitcoin. Bollinger, known for developing the popular technical analysis tool Bollinger Bands, highlighted a worrying pattern in the Litecoin market.
He remarked, “I was asked for an analysis of LTCBTC. The thing that concerns me the most is its underperformance vs Bitcoin. From a price perspective the controlling LTCUSD feature is the 2 bar reversal at the lower Bollinger Band which is typically considered a bearish signal by traders.”
Bollinger’s Bearish Litecoin Prediction Explained
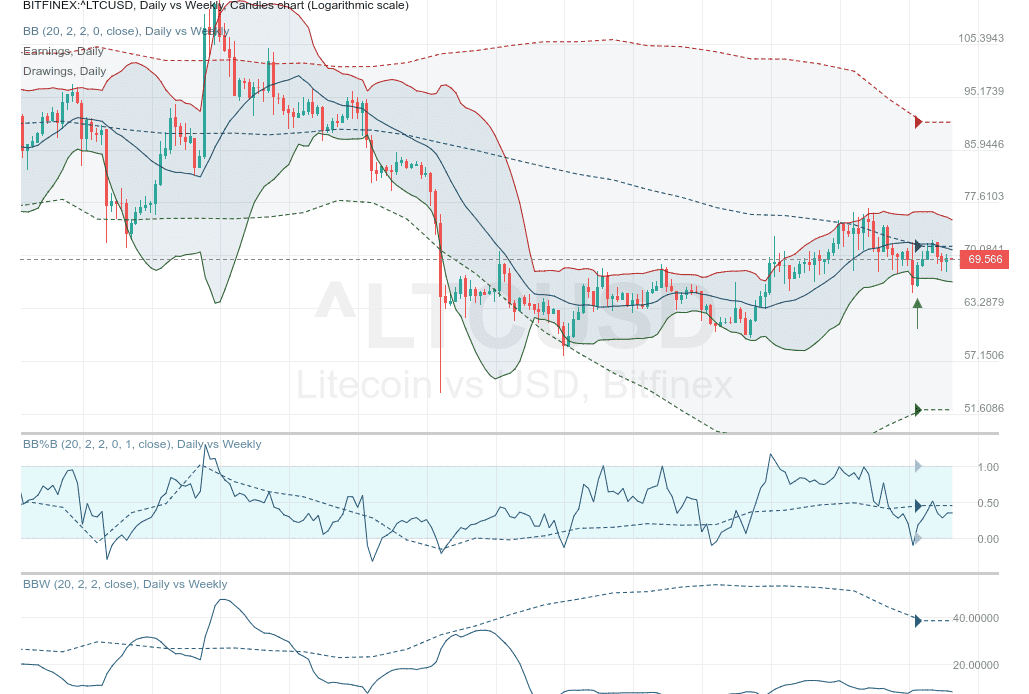
The chart of the LTC/USD pair provided by Bollinger on November 28, 2023, shows Litecoin’s price action in relation to its Bollinger Bands on both a daily and weekly scale. The price is currently hovering around $69.566, which is significantly lower than the upper Bollinger Band, suggesting a lack of bullish momentum.
The Bands form by plotting a range of standard deviations above and below a simple moving average, commonly enveloping the price action. In this chart, the daily vs. weekly candles chart shows that the LTC/USD price is struggling beneath the midpoint of these bands, which is a bearish indication. The price currently near $69.566 is substantially below the upper band level of around $90, which represents a potential resistance level.
The Bollinger Bands (BB) on the chart are set with a 20-period moving average with a 2 standard deviation range. Bollinger’s analysis points to a ‘2 bar reversal’ pattern at the lower band. This pattern emerges when a bar reaches a high above the preceding bar but then closes below the close of that same previous bar, hinting at a possible reversal from the uptrend. Such a pattern took place near the lower band, indicating that any effort to drive the price higher meets with resistance, and the prevailing selling pressure is taking hold.
The Bollinger %B indicator is also crucial here as it compares the price of Litecoin to the range defined by the Bollinger Bands. A %B value below 0.5 indicates that Litecoin’s price sits nearer to the lower band than to the upper band, potentially signaling weakness. The chart shows the indicator failing to cross the 0.5 level after a plunge toward 0, signifying that the price frequently touches or falls below the lower band.
LTC Price Under Pressure
The Bollinger…
Click Here to Read the Full Original Article at NewsBTC…


