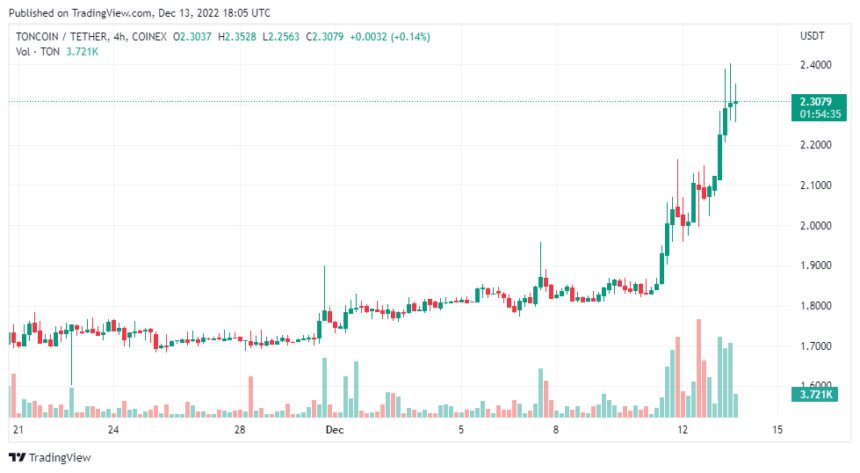
Toincoin is trading at $2.30, gaining 10.61% in 24 hours. The price change in this period is 0.3172. The 24-hour low is $2.05, while the 24-hour high is $2.37.
Despite the recent events in the crypto space, TON has enjoyed a positive price surge today, recording gains in a volatile crypto market.
The trading volume is up by 40% at $66,552,790. According to CoinMarketCap, its market capitalization stands at $2,808,494,330.
TON is currently ranked number 22 on the crypto market list showing massive investor attention. Its affiliation with Telegram has also helped the project to soar in popularity even if it has been rebranded.
Although the TON coin is still some way off its all-time high value of $5.84, it has enjoyed a positive week and might close 2022 on a high note.
What Is Behind Toncoin’s Price Gains?
Toncoin is a decentralized blockchain (layer-1) built by the developers of the popular social messaging app Telegram.
Toncoin utilizes a proof-of-stake mechanism which has increased its adoption time. This mechanism encourages investors to profit by staking their tokens for rewards rather than going through the rigors of mining.
Toncoin price has seemingly surged due to investors rekindling their interest in the project. The Network uses sharding to operate its blockchains and is efficient and scalable.
While the crypto winter has persisted and with the dip in bitcoin, investors are looking to diversify. Also, the general crypto market has seen little gains in the last two weeks despite investors’ fears.

TON Likely To Sustain Its Rally
TON’s support levels of 1.123 and 1.572 have been held. TON has broken through the resistance level of 1.835 with 2.998, the next level it will likely surpass. Overtaking the next resistance level will launch Toncoin into a full bull run.
TON is currently trading above its 50-day and 200-day SMA. This shows that the assets’ short-term and long-term price movements are positive. The formation of long green candles on the chart’s right side indicates the bullish pressure.
The RSI reading is firmly in the overbought region at 72.48, meaning the asset is giving off a strong buy signal for investors.
The MACD (Moving Average Convergence/Divergence) is above its signal line and displays the positive price movement on the chart.
TON will likely sustain this pressure and finish the year strong if the bulls…
Click Here to Read the Full Original Article at NewsBTC…


