
Bitcoin’s price has been glued to the low $20,000 levels for a while now, showing little or no sign of any major upward movement in the near future. The market has been sporadically showing signs of capitulation with a lack of optimism for a bull reversal in the coming weeks.
On the surface, multiple on-chain and macro signs point to a complete loss of confidence in the market. However, diving deeper into these fundamentals shows that not everything is so bleak.
In the past five weeks, the S&P 500 saw one of its most volatile periods, surpassed only by the stock crisis we’ve seen in the late 1920s and mid-1970s. Since the beginning of the year, the index posted a 13% loss.
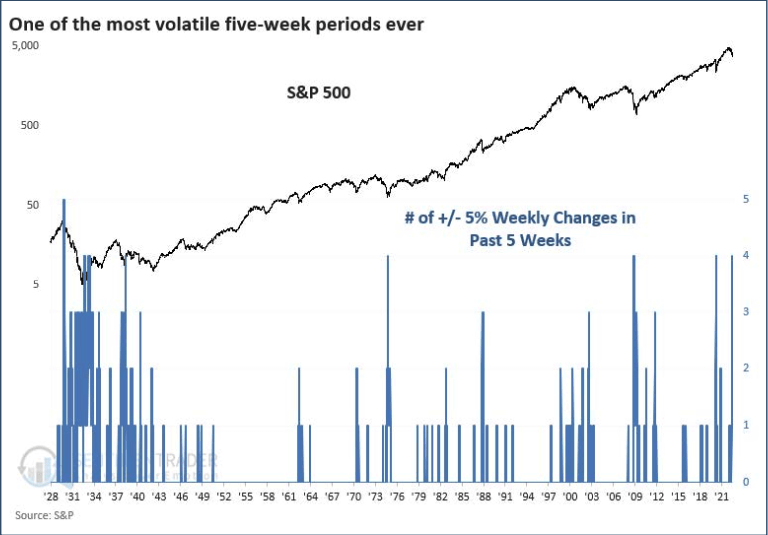
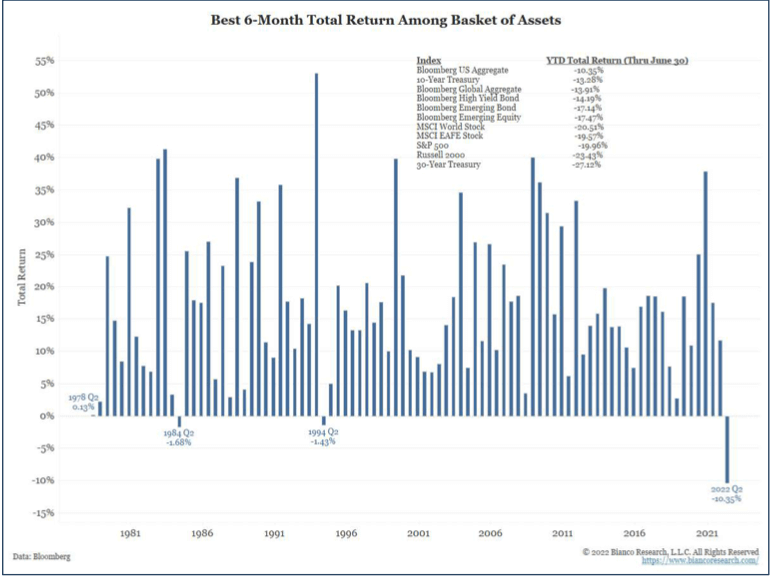
Other indexes have performed equally as badly. So far, 2022 has been one of the worse years for index returns, with the Dow Industrial Average, the Nasdaq 100, and the NYSE Composite posting losses of 10%, 19%, and 11%, respectively.
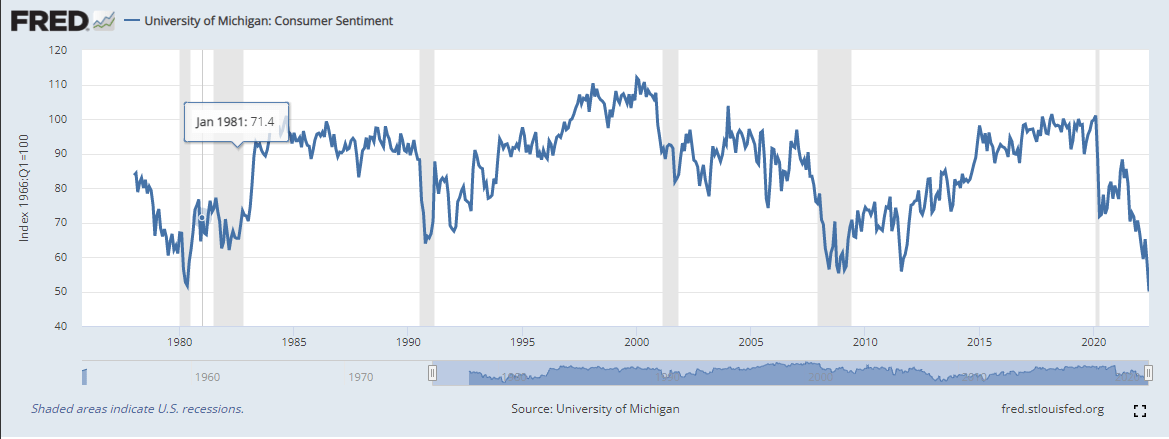
The increased volatility of the traditional market, combined with the worsening global socioeconomic outlook, has also pushed consumer sentiment to an all-time low. The only other time in the past 40 years that consumer sentiment dropped as low was at the beginning of the 1980 recession in the U.S.
While Bitcoin has been matching the traditional market regarding performance, several on-chain indicators show that it could be nearing the end of its capitulation period.
One of the best measurements of Bitcoin’s strength has always been miner confidence. Seen as the most resilient players in the crypto ecosystem, miners capitulating has almost always signaled Bitcoin’s bottom. It has also often been a solid buy signal, as every period of miner capitulation was followed by a trend reversal and an onset of a bull run.
Determining whether miners have capitulated requires looking further than the current hash rate. Hash ribbons are an indicator containing two moving averages of Bitcoin’s hash rate — the 30-day and the 60-day simple moving averages (SMAs). During bull markets, the 30-day SMA rises faster than the 60-day one, while bear markets push the 30-day SMA below the 60-day SMA.
The 30-day SMA dropping below the long-term SMA marks the beginning of a miner capitulation period, which ends once the trend…
Click Here to Read the Full Original Article at Bitcoin (BTC) News | CryptoSlate…


