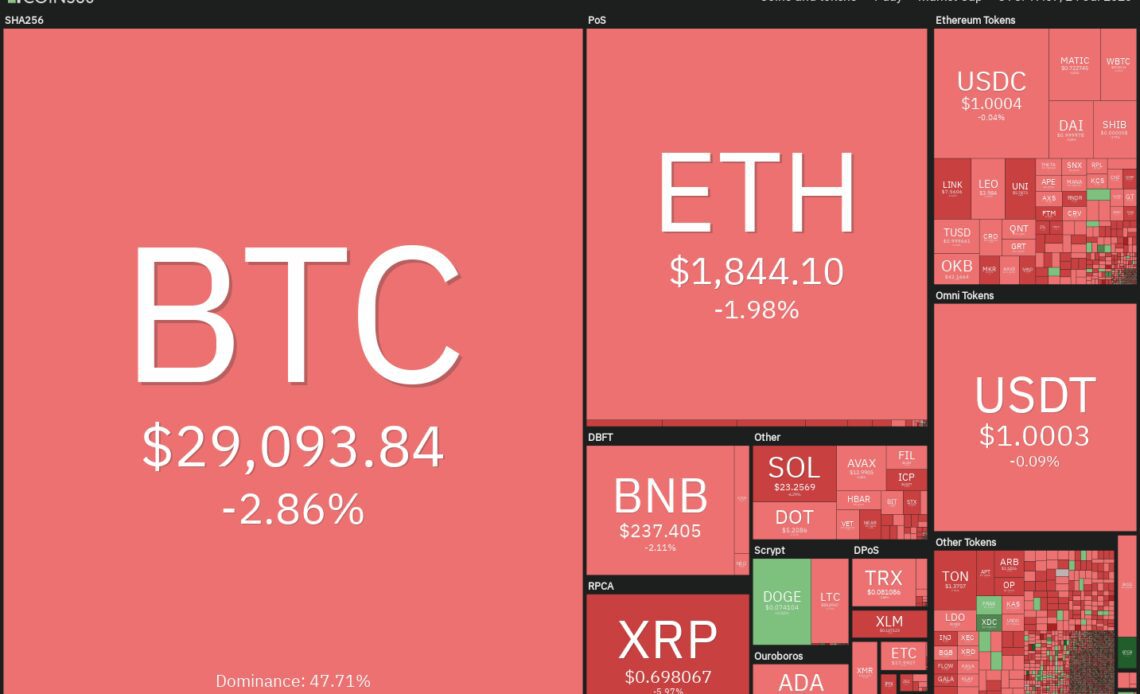
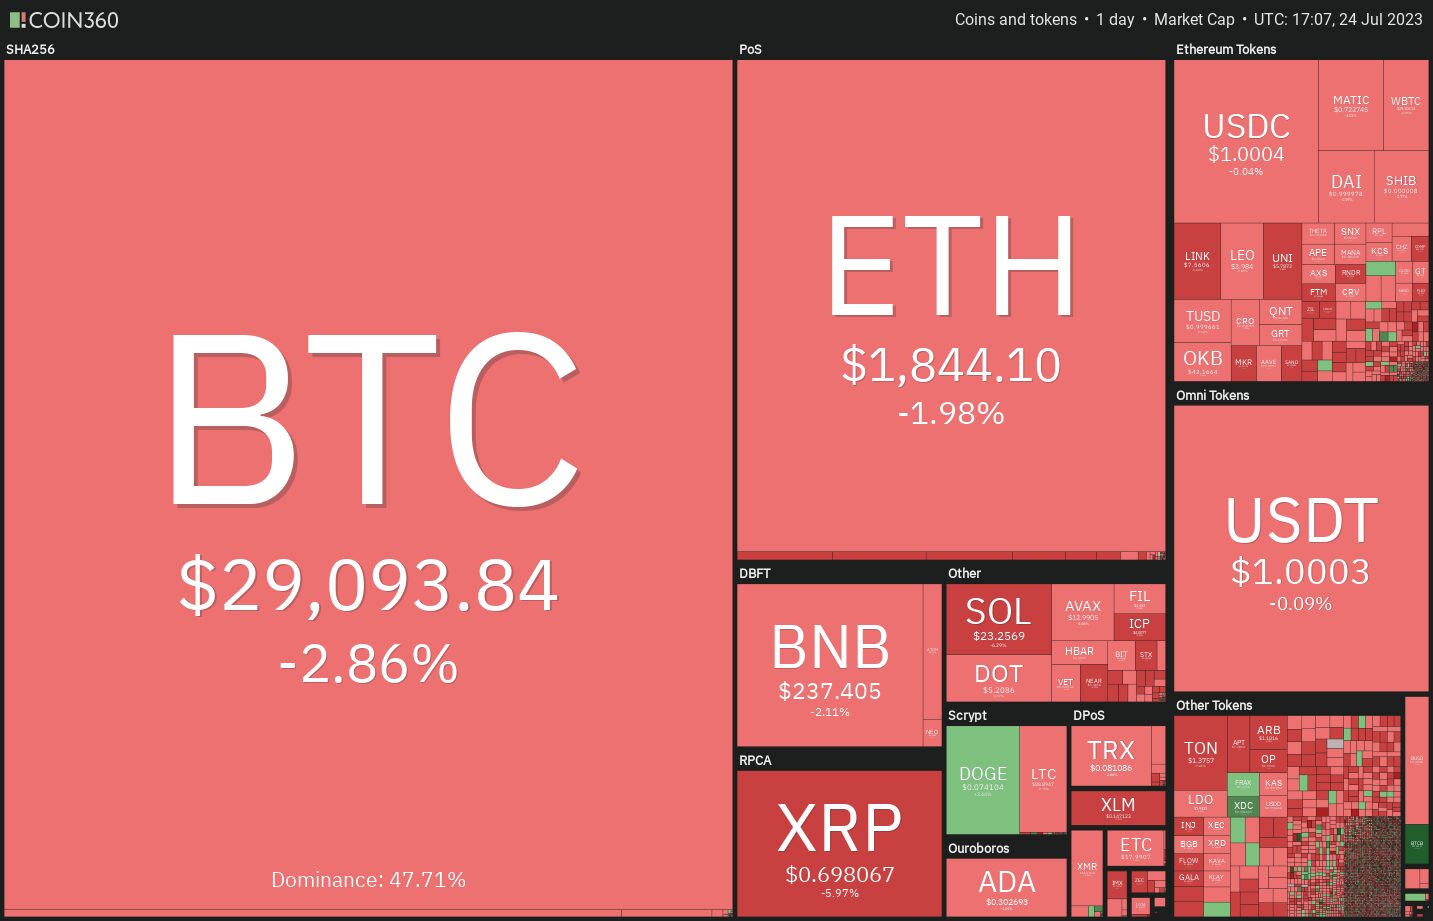
Bitcoin (BTC) plunged to $29,000 on July 24, signaling that bears are trying to seize control. It looks like the failure to hold on to the higher levels may have tempted short-term bulls to book profits and aggressive bears to initiate short positions.
Although the near term looks bearish, long-term investors remain unfazed and they continue to hold on to their positions. Glassnode data shows that Bitcoin’s Long-Term Holder Supply made a new high of 14.52 million Bitcoin, “equivalent to 75% of the circulating supply.”
While the cryptocurrency markets have turned soft in the near term, the United States equities markets remain on a strong footing. The Dow Jones Industrial Average has risen for ten straight days, its longest streak since 2017. However, things could change this week with a slew of key earnings reports and the Federal Reserve’s policy decision on July 26. The latter could also impact the U.S. dollar index (DXY), which is on a recovery path.
Could lower levels attract buyers in Bitcoin and select altcoins? Will the strength in the U.S. equities markets limit the downside in the cryptocurrency markets? Let’s analyze the charts to find out.
S&P 500 Index price analysis
The S&P 500 Index (SPX) turned down from 4,578 on July 19 but a positive sign is that the bulls have not given up much ground. This suggests that the buyers are not dumping their positions as they anticipate the uptrend to continue.
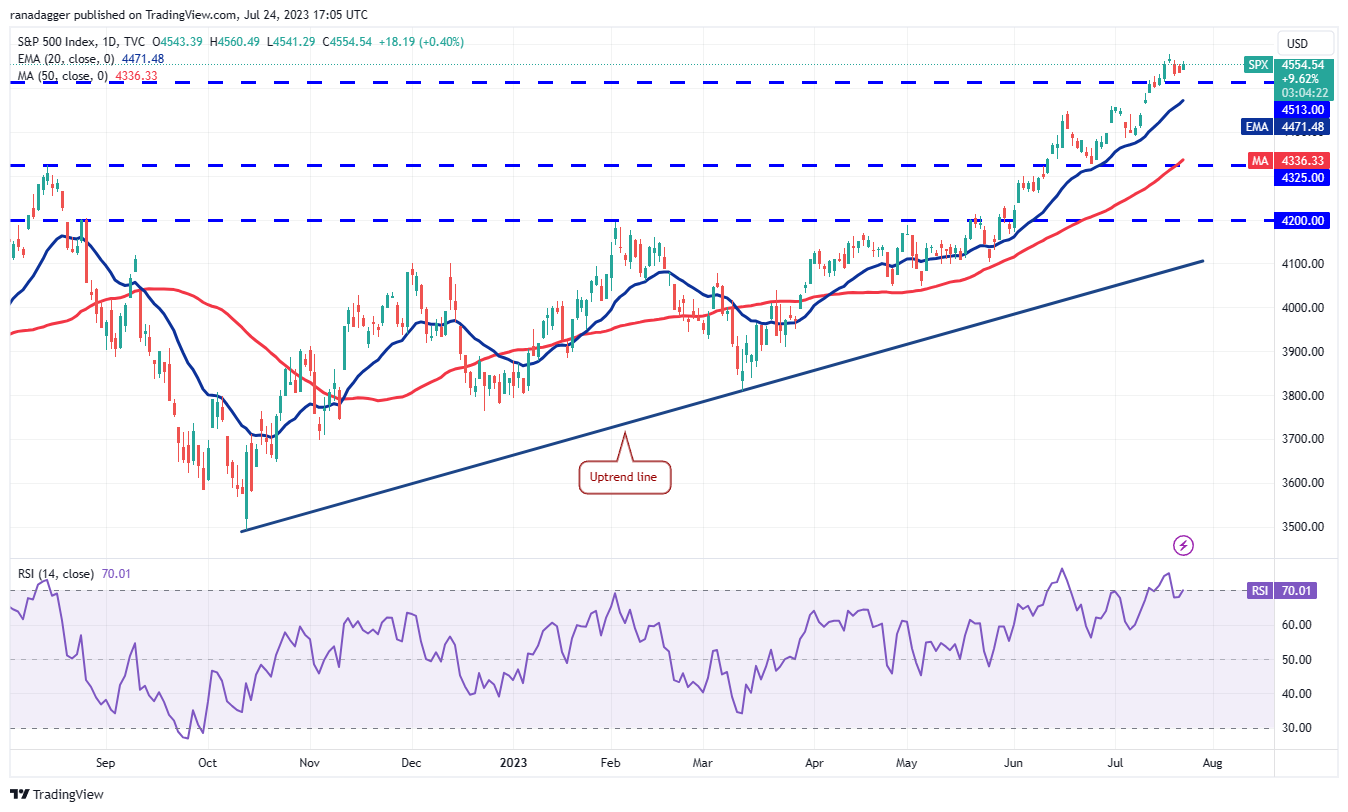
The upsloping 20-day exponential moving average (4,471) and the relative strength index (RSI) in the overbought territory suggest that bulls are in command. If the price turns up from 4,513 or the 20-day EMA, it will suggest that lower levels continue to attract buyers.
That will enhance the prospects of a break above 4,578. The index could then rally to 4,650 and eventually to 4,800.
This positive view will be negated if the price dives below the 20-day EMA. That could open the doors for a fall to the 50-day simple moving average (4,336).
U.S. dollar index price analysis
The U.S. dollar index turned up sharply on July 18 and rose back above the breakdown level of 100.82 on July 20. This suggests that the breakdown below 100.82 may have been a bear trap.
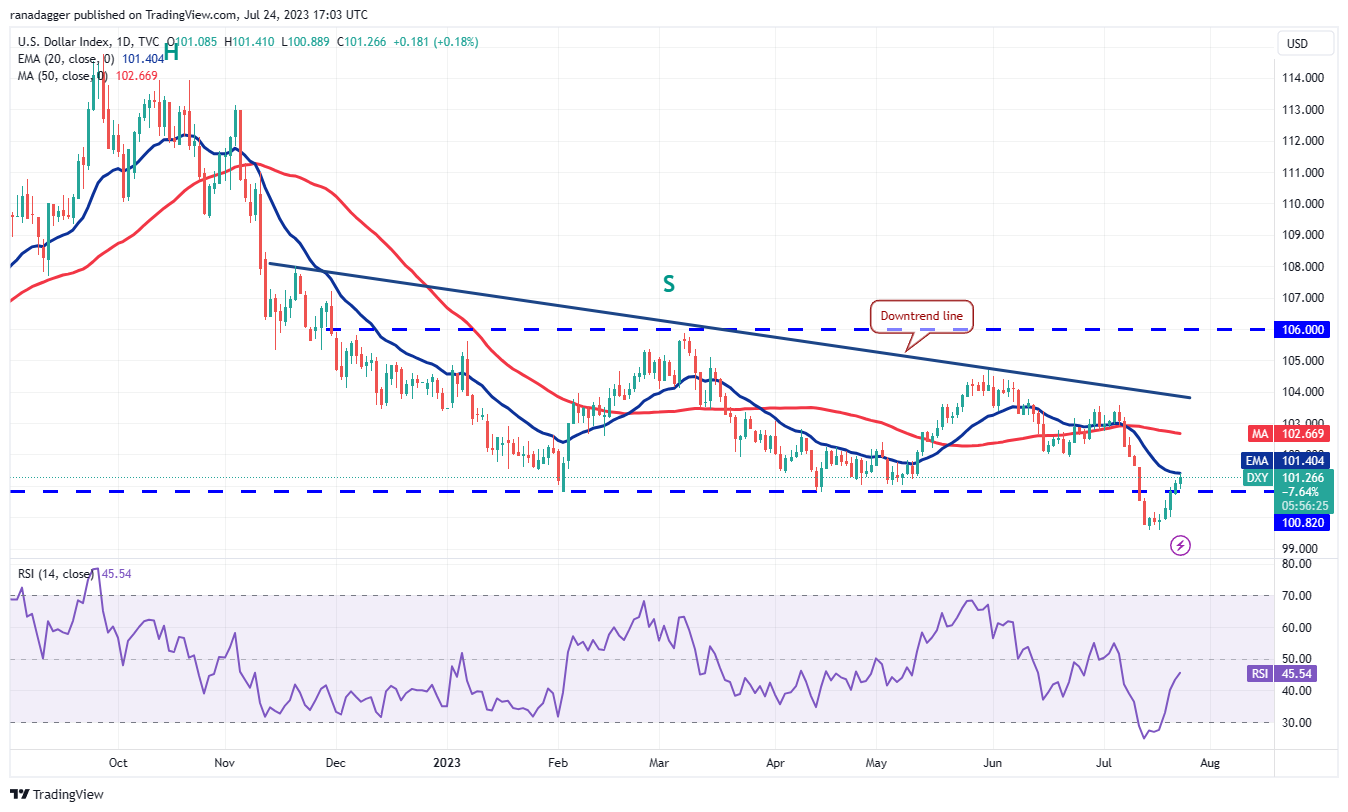
The price has reached the 20-day EMA, which is an important level to watch out for. If the price turns down sharply from it and plunges below 99.57, the downtrend may…
Click Here to Read the Full Original Article at Cointelegraph.com News…


