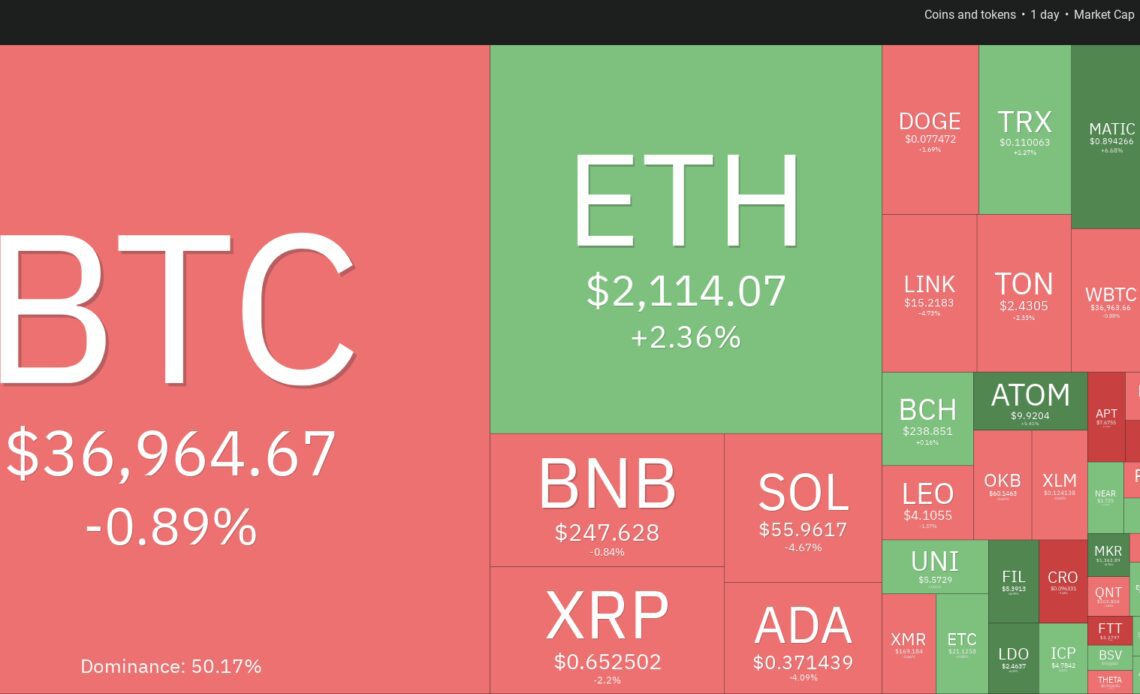
Bitcoin (BTC) has risen more than 120% year-to-date, indicating that the crypto sentiment has improved significantly. Solid buying has resulted in a sharp increase in crypto wallets holding more than $1 million in Bitcoin this year from 23,795 on Jan. 1 to 81,925 currently, according to BitInfoCharts data.
After the substantial rally, Bitcoin could face headwinds in the near term as investors digest the macroeconomic data and events due this week. The Consumer Price Index data is set to be released on Nov. 14, followed by the Producer Price Index data on Nov. 15, and the Nov. 17 deadline to avoid a partial United States government shutdown could give rise to short-term volatility.
A short-term pullback is healthy for the long-term trend of the market. It is also likely to be viewed as a buying opportunity by traders as most analysts anticipate Bitcoin to rally in 2024, buoyed by the expectations of a spot Bitcoin exchange-traded fund finally receiving regulatory approval.
Will Bitcoin and select altcoins start a short-term correction, or will the bulls maintain their buy pressure and clear the respective overhead resistance levels? Let’s analyze the charts to find out.
S&P 500 Index price analysis
The S&P 500 Index (SPX) snapped back from the neckline on Nov. 9, indicating that the bulls are buying on every minor dip.
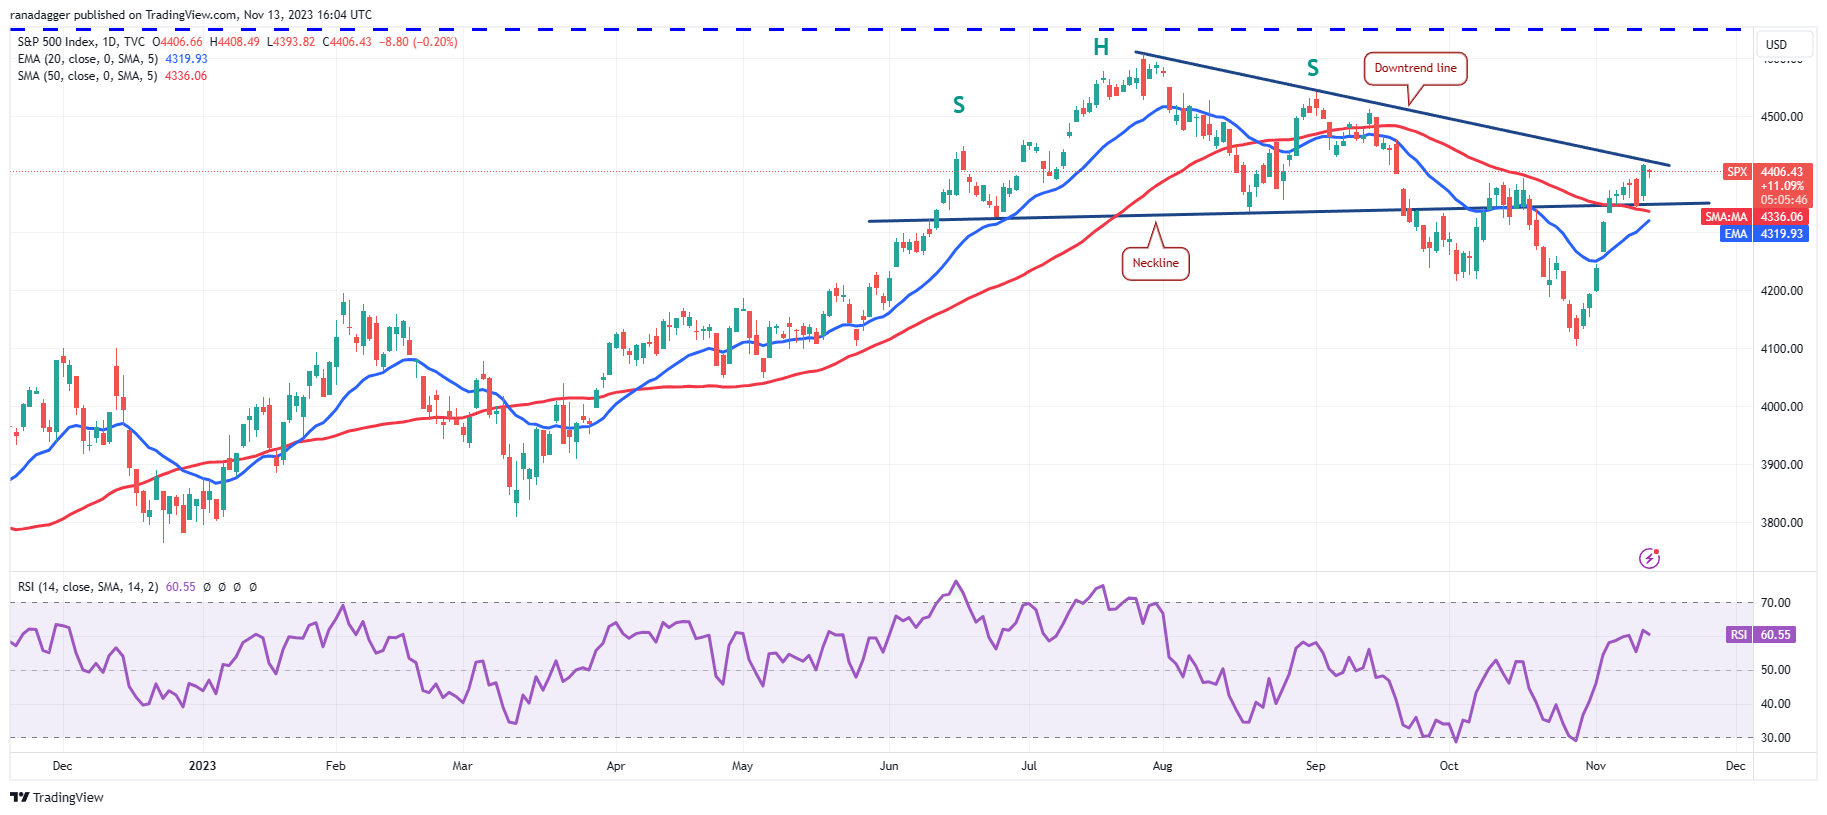
The 20-day exponential moving average (4,319) has started to turn up, and the relative strength index (RSI) has risen into the positive zone, indicating that the bulls are in command. A break and close above the downtrend line will clear the path for a rally to 4,512.
However, the bears are unlikely to give up easily. They will try to fiercely protect the downtrend line and drag the price below the neckline. If they do that, the index may drop to the 20-day EMA. Sellers will have to sink the price below the 20-day EMA to come out on top.
U.S. Dollar Index price analysis
The U.S. Dollar Index (DXY) tumbled below the descending channel pattern on Nov. 3, but the bears could not build upon this advantage and start a deeper correction.
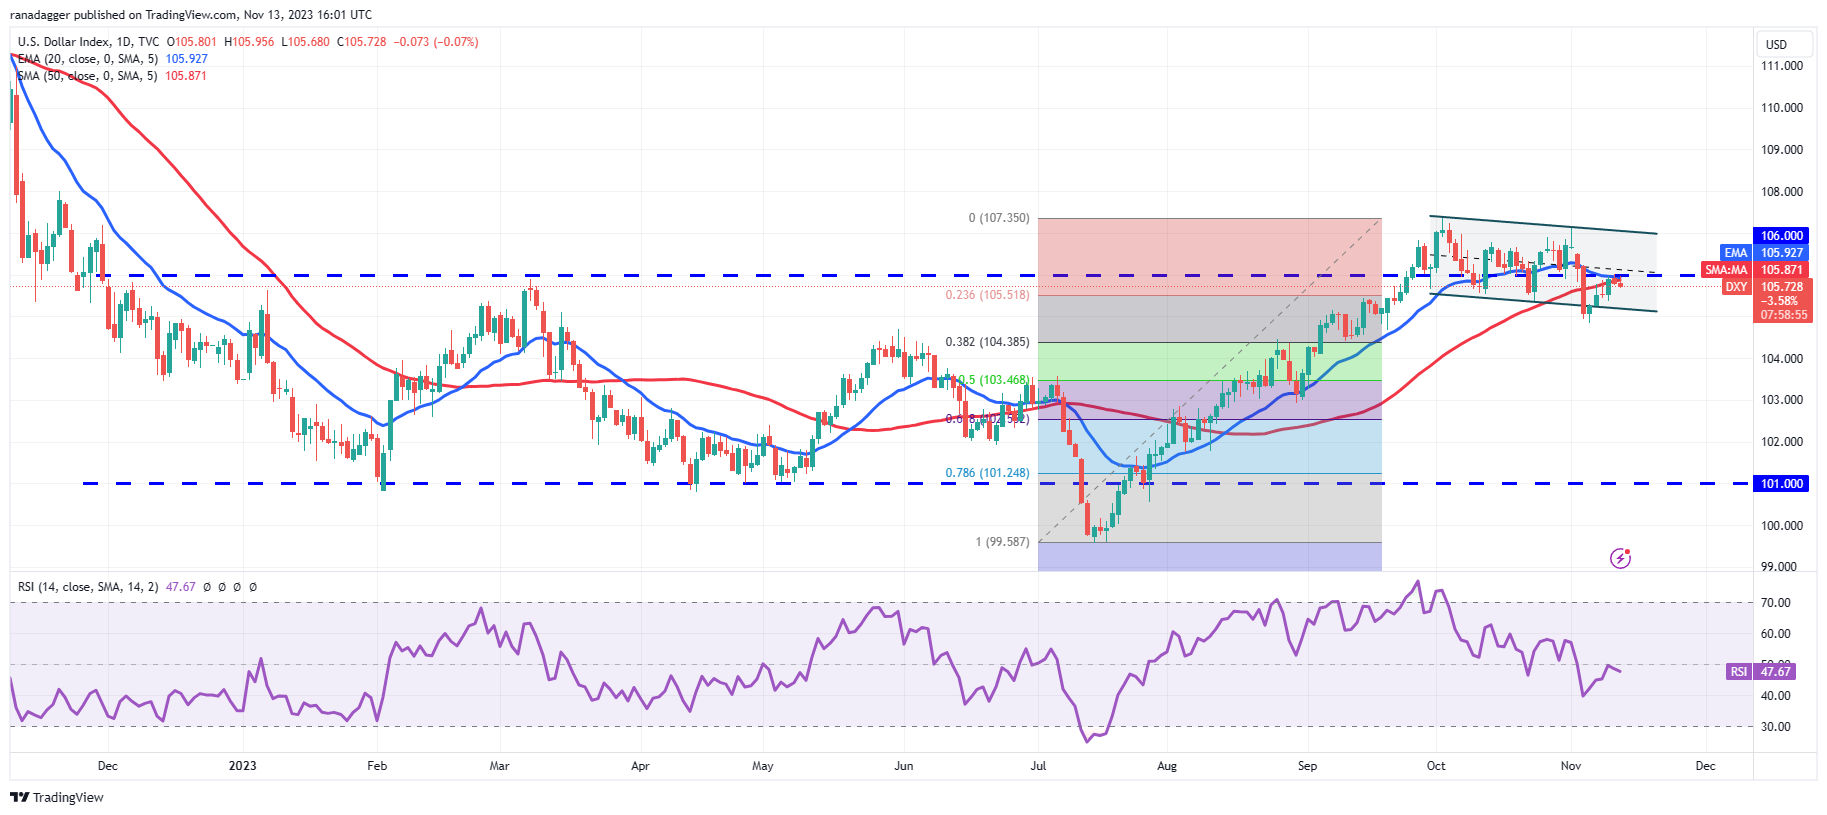
That started a recovery, which has reached the 20-day EMA (105.92). If the price turns down sharply from the current level, it will suggest that the sentiment has turned negative and traders are selling at the 20-day EMA. That could pull the price down to the 38.2% Fibonacci retracement level…
Click Here to Read the Full Original Article at Cointelegraph.com News…


