Solana had witnessed strong bullish force in the past seven days, however, the bulls lost steam at the time of writing. Over the last 24 hours, the coin depleted by 9%. The current support level for SOL stood at $38. The price of the asset registered a month high after the massive rally that took place on July 13 . Technical outlook for Solana pictured the bears taking over.
After Bitcoin dipped on its chart by 6% over the last day, altcoins too had the same effect on their charts. Buying strength of Solana depreciated considerably flashing negative price action. After a relief rally, it is usually not uncommon for coins to retrace on their charts.
If buying strength gains strength, then Solana might again break past its current price level and aim for the overhead price ceiling. If SOL manages to move the $44 price mark, a visit to the $50 doesn’t seem too difficult. Buying strength and broader market strength will help Solana regain price momentum. The global cryptocurrency market cap today is $1.07 Trillion with a 5.1% negative change in the last 24 hours.
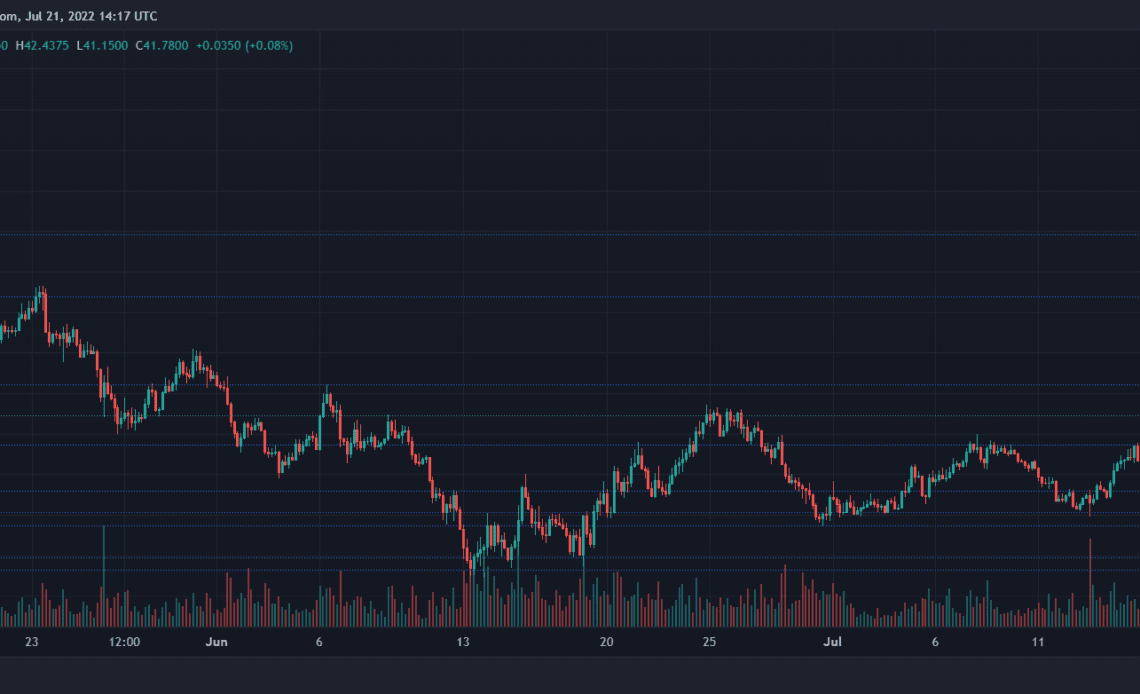
Solana Price Analysis: Four Hour Chart
SOL was trading at $41 at the time of writing. The bulls lost momentum once it hit the $46 price mark. Overhead resistance for Solana was at $48, a move above which could help Solana touch $50 and even go above it.
A fall from the current price mark will ensure that SOL touches the $38 mark and then touch the $30 support line. If buying strength maintains momentum, SOL might hover around the same price area before it attempts to rise further. Amount of SOL traded increased signifying a rise in buying strength which can be an indication of a recovery on the four hour chart.
Technical Analysis
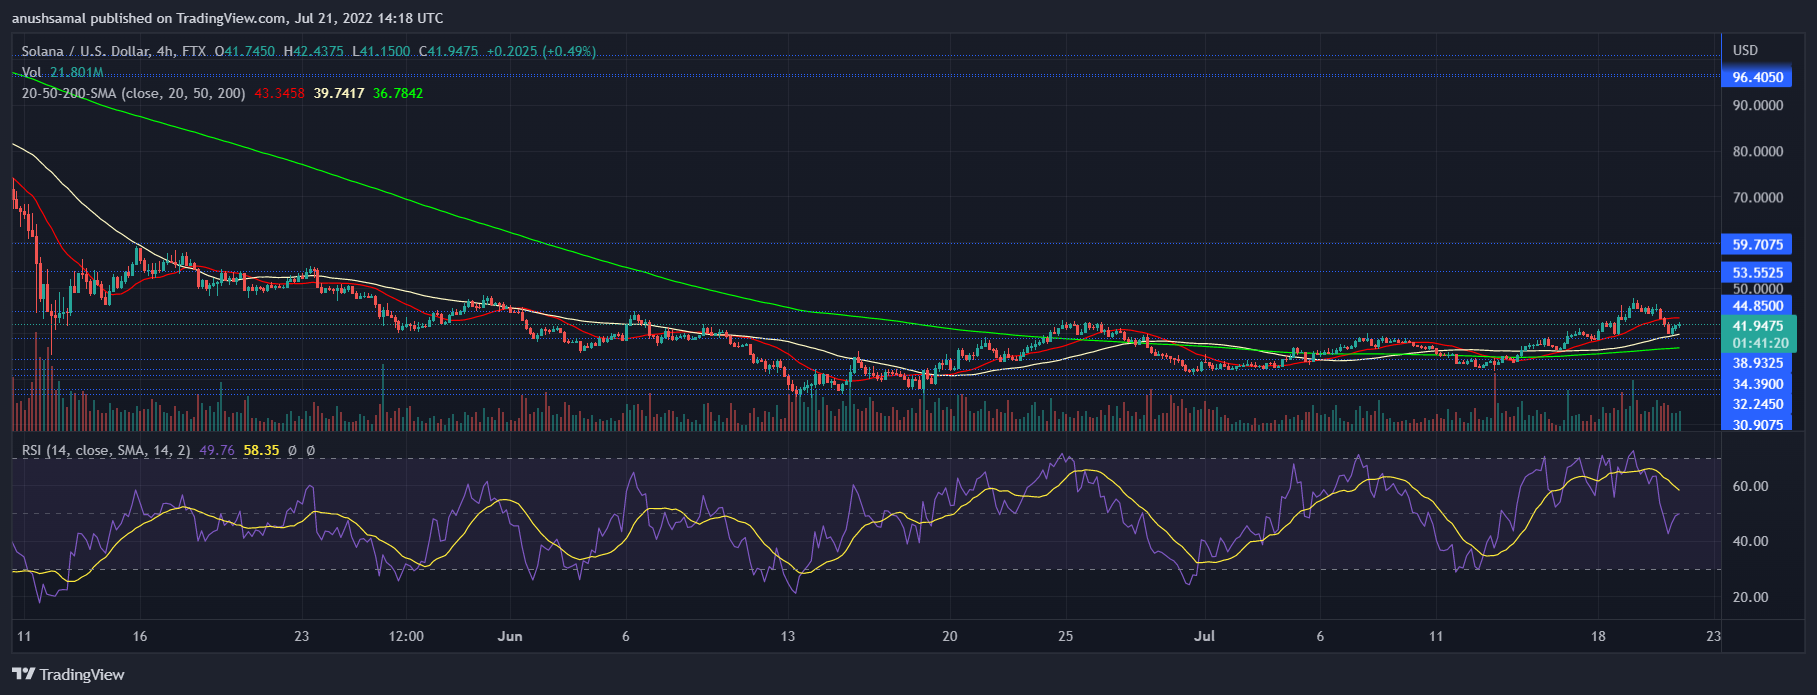
The altcoin’s buying strength remained low, sellers were dominating the price action on the chart. In accordance with the same, the Relative Strength Index displayed the same emotion. RSI was pictured underneath the half-line and that meant decreased buying strength.
Although there was a fall in the number of buyers, the indicator noted an uptick which can be considered bullish. Price of SOL was below the 20-SMA, which indicated that in the short-term time duration sellers were driving the price momentum. Solana was however above the 50-SMA and 200-SMA which signified that bullish action…
Click Here to Read the Full Original Article at NewsBTC…


