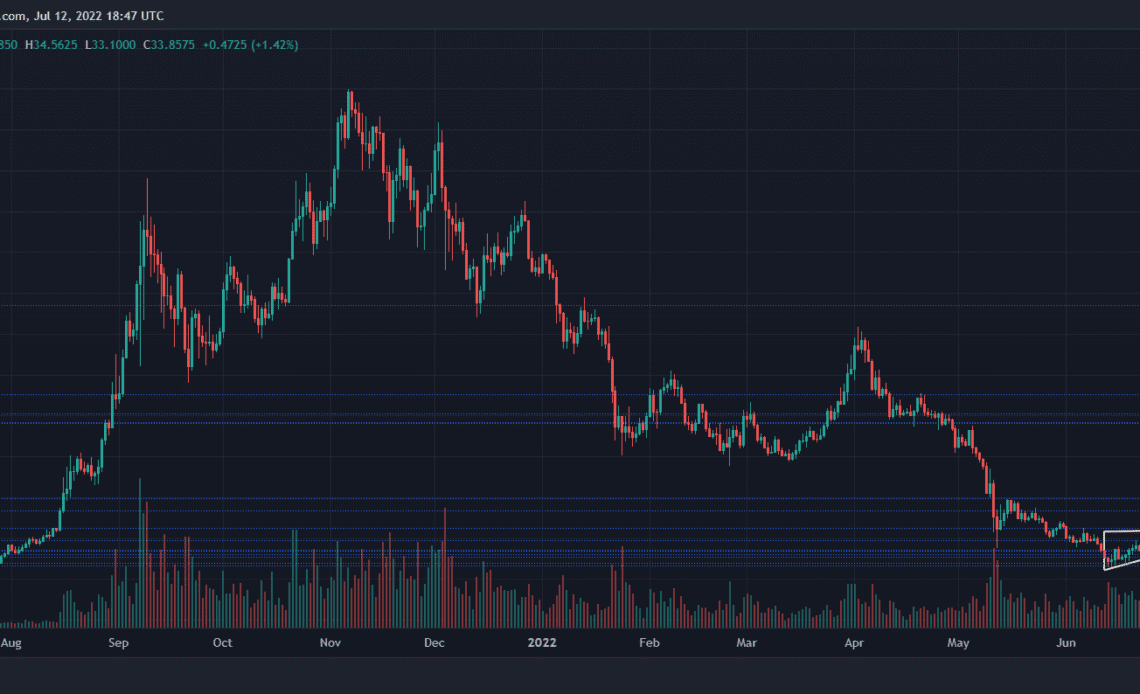
Solana was on a downtrend as the bulls have lost steam after SOL fell below the support line of $38. Over the last 24 hours the coin depreciated 4% and in the last week, the coin fell by 8%. Price of Solana was pushed to $33, however, at press time the coin was trading slightly above the support line.
Bitcoin too struggled below the $20,000 mark and the altcoins walked the same price path. Broader market weakness continues to contribute towards the altcoins bearish pressure. One the daily chart, Solana had formed an ascending triangle but it managed to break below the same.
If the coin continues on the same path then it could move below the $30 price mark. The current vital support level for the altcoin stood at $33. Buying pressure declined on the daily chart as SOL met with a sell off. The global cryptocurrency market cap today is $924 Billion with a 3.1% negative change in the last 24 hours.
Solana Price Analysis: One Day Chart
SOL was trading at $33.40 at the time of writing. It moved precariously close to the critical price floor of $33. A fall in price below the $33 price mark will first drag SOL to $30 and then to $27.
Due to increased bearish strength, SOL broke below the ascending triangle (yellow).
Continued downward movement can cause another 18% fall on SOL’s chart. If Solana manages to move above the $34 price level and topple the $38 price mark, the bearish thesis stood a chance to be invalidated.
The immediate resistance was at $34 and then at $38. Trading volume of Solana dropped slightly but the bar was green which indicated that buyers still attempted to stand their ground on the chart.
Technical Analysis
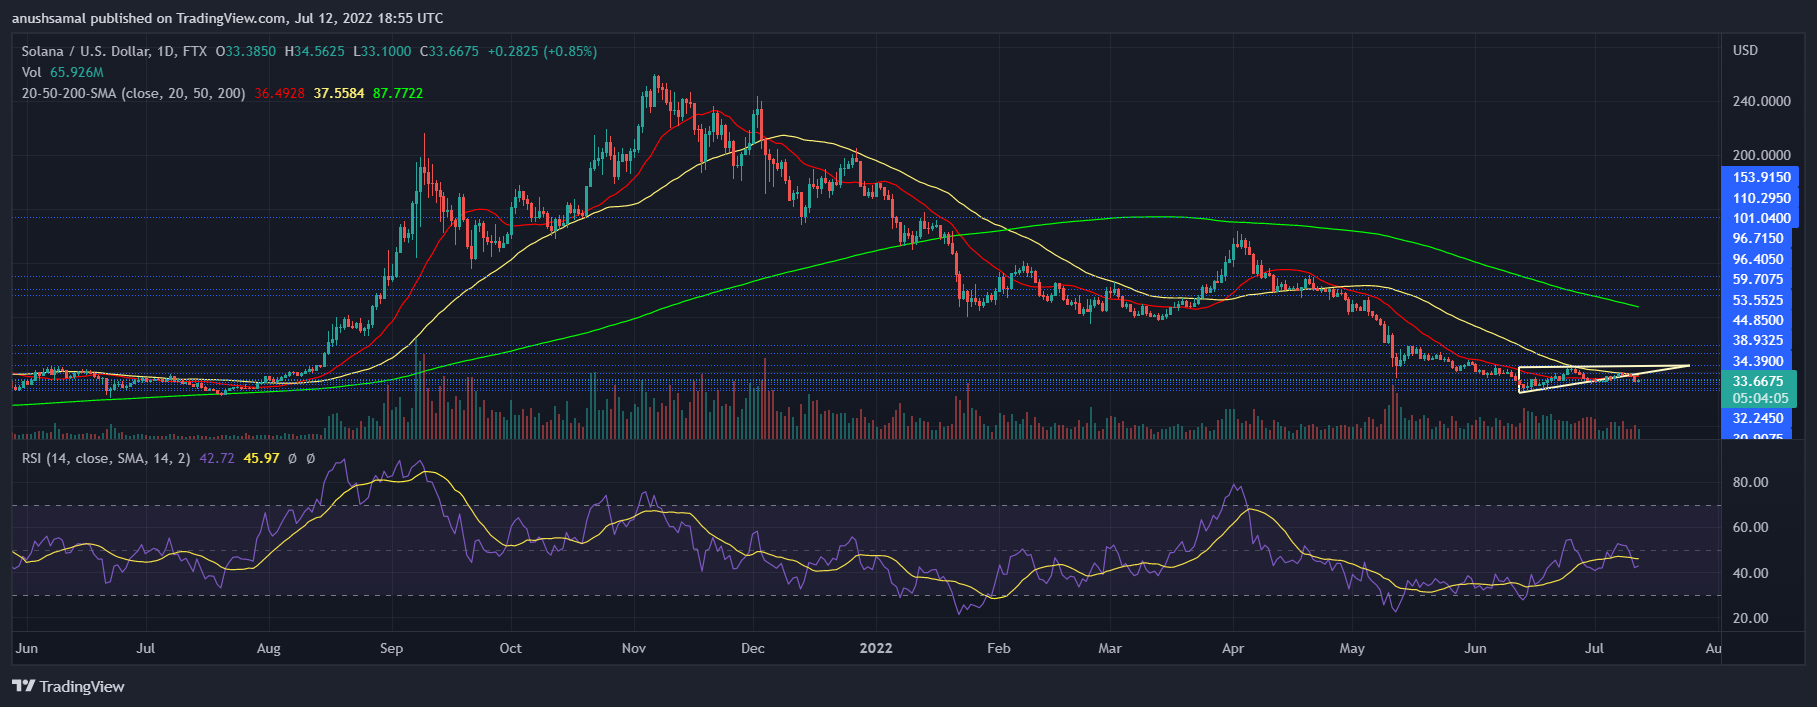
SOL’s buying strength has remained delicate with the coin witnessing regular sell-offs in the market. For the most of May, June and July, Solana has witnessed high selling pressure.
In accordance with the same, the Relative Strength Index was below the half-line which meant that sellers dominated the market.
Price of SOL was seen below the 20-SMA, a reading that indicated sellers were responsible in driving the price momentum in the market.
Suggested Reading | Solana Glints With 14% 3-Day Rally – Will SOL Keep On Beaming?
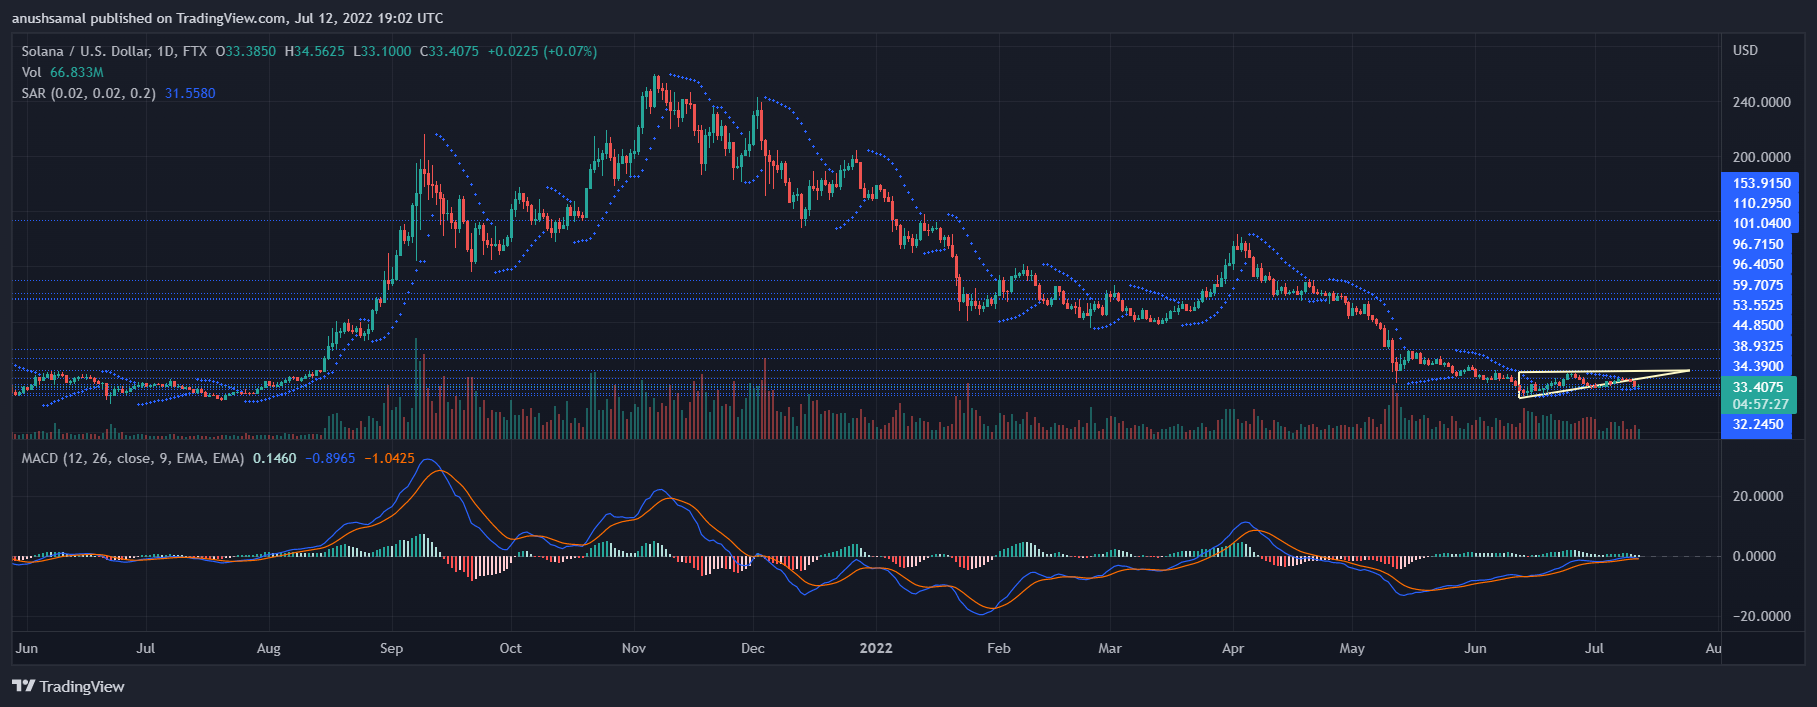
SOL’s chart displayed mixed technical signs. The…
Click Here to Read the Full Original Article at NewsBTC…


