In line with the broader trend in the overall crypto market, the Solana (SOL) price has fallen by 7.5% in the last 24 hours. However, according to renowned analyst Rekt Capital, there is no reason to switch to the bearish side.
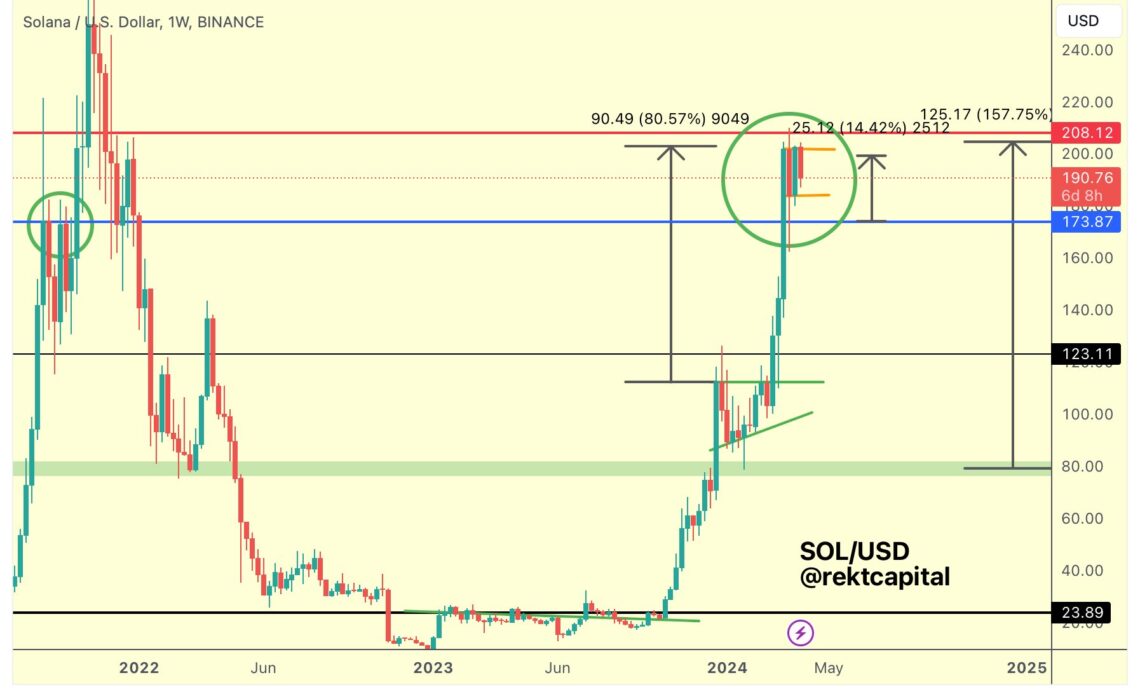
In a recent technical analysis, the crypto analyst highlighted that Solana is currently showing potential for an 80% price rally based on its present consolidation pattern. According to Rekt Capital, Solana is trading within what appears to be a bull flag formation, as depicted on the weekly SOL/USD chart from Binance.
A Bull Flag pattern occurs after a strong, almost vertical price rise and is characterized by a downward-sloping consolidation that resembles a flag on a pole. The “pole” is formed by the initial price surge, while the “flag” represents a period of consolidation with converging trendlines.
Traders often watch for a decisive breakout above the flag, which can signal the continuation of the prior uptrend. In Solana’s case, the analyst points out that Solana recently faced a rejection at the top of the bull flag pattern at $208, indicating a short-term setback in its upward trajectory.
“And if Solana keeps this up, it may form a Bull Flag here before breaking out to challenge that Range High $208 resistance again,” Rekt Capital noted.
However, the bottom of this bull flag, which stands at approximately $184, is identified as a critical support level that needs to be maintained to keep the bullish momentum alive. Should Solana manage to hold above this level, the setup may favor the continuation of the uptrend.
Notably, Rekt Capital adds that while occasional dips or “wicks” into the $173 range are acceptable, the price must generally remain above the $184 support on the weekly time frame to validate the bullish outlook. The $173 price level is marked by a blue horizontal line on the chart, serving as an additional support zone.
In terms of price targets, the chart reveals an 80.57% potential rally from the bottom of the bull flag (“pole flag”), which could translate into a target price of approximately $330 if the bull flag pattern is confirmed in the coming days or weeks.
Solana Bears Gain The Upper Hand On The Lower Time Frames
On the lower time frames, like the 2-hour chart, the Solana price lost some momentum, indicating potential short-term consolidation or downward movement. SOL experienced a sharp -13% decline,…
Click Here to Read the Full Original Article at NewsBTC…


