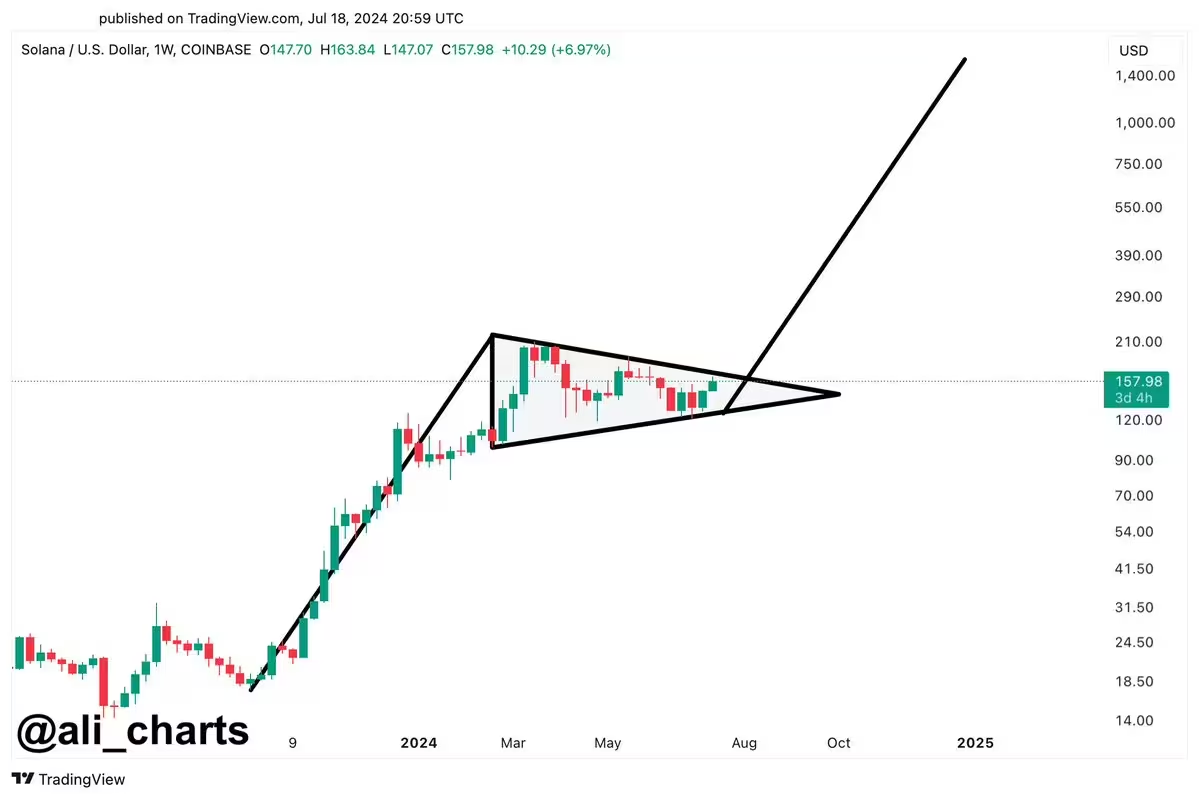
The Solana price has surged over 33% in the past two weeks, and according to crypto analyst Ali Martinez (@ali_charts), this could be the precursor to a much larger rally. In the weekly chart (SOL/USD), the Solana price exhibits a major bullish pattern, suggesting a potential surge beyond the $1,400 mark.
Is $1,400 Next For Solana?
Martinez highlighted a “bull flag” formation, a classic continuation pattern in technical analysis that could signify a significant upward movement in Solana’s value in the upcoming months. “The bull flag nobody is talking about!” Martinez commented.
The chart displays a bull flag pattern, identified through a sharp upward trend followed by a consolidating downward channel. This pattern began forming after a strong price increase from mid-September last year, where Solana ascended from around $17.50 to a peak of approximately $210. Following this rise, the price began to consolidate, forming a downward sloping channel that suggests a period of accumulation and potential buyer exhaustion after the initial surge.
Related Reading
The flagpole, an essential component of the bull flag pattern, was established by the initial steep increase in price, while the flag itself is represented by the subsequent consolidation phase. This phase is depicted by a series of higher lows and lower highs, converging into a narrowing point that suggests decreasing volatility and tightening price ranges—a typical precursor to a potential price breakout.
According to Martinez’ analysis, the price of Solana stands at $157.98 and thus just below the upper trendline of the channel. The consolidation has formed within a tight range, with the upper and lower boundaries clearly marked by trend lines converging towards a point on the chart projected to occur soon. The critical support level, as observed from the consolidation phase, is near the $130 mark, with the resistance level just slightly above the current price, around $160.
Related Reading
If the bull flag pattern holds true to its typical implications, a breakout could be expected upon reaching the apex of the converging trend lines. Historically, the projected target of a bull flag breakout is estimated by measuring the length of the flagpole—more than 1,000% in SOL’s case—and projecting it upwards from the point of breakout or from the support level (in a more conservative alternative).
This calculation…
Click Here to Read the Full Original Article at NewsBTC…


