Solana has started another decline, falling below the $137 support level, signaling that bearish momentum is gaining traction. The once-promising uptrend has faltered, leaving traders and investors wondering if more losses are on the horizon. As selling pressure intensifies, the question now is whether Solana can find a new foothold or if the bears will continue to push its price lower.
In this analysis, we’ll provide an in-depth analysis of Solana’s recent breakdown below this key support level, examining the growing bearish momentum and exploring the key levels to watch and what could come next for Solana.
As of the time of writing, Solana was trading at approximately $131, reflecting a 4.67% decline with a market capitalization exceeding $16 billion and a trading volume surpassing $1.6 billion. Over the past 24 hours, SOL’s market cap has dropped by 4.65%, while trading volume has surged by 92.92%.
How Low Can Solana Fall?
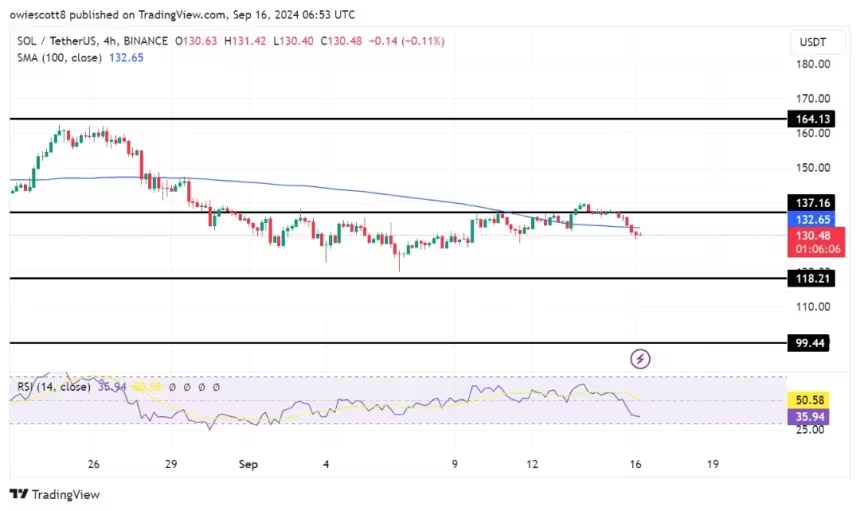
On the 4-hour chart, Solana (SOL) has shown a clear shift in momentum toward the bearish side, as it decisively breaks below the critical $137 level along with the 100-day Simple Moving Average (SMA). This breakdown reflects a weakening technical setup, with sellers gaining the upper hand and pushing SOL toward the $118 support zone. Particularly, the breach of the 100-day SMA, a widely-watched indicator of the overall market trend, suggests that negative momentum is not only increasing but may also signal a prolonged downside movement
Also, the Relative Strength Index (RSI) on the 4-hour chart has dropped below the 50% threshold, now sitting at 35%. With the RSI attempting to move deeper into the oversold territory, it shows that bears are gaining control, and further downside could be on the horizon if buying interest doesn’t pick up soon.
Related Reading
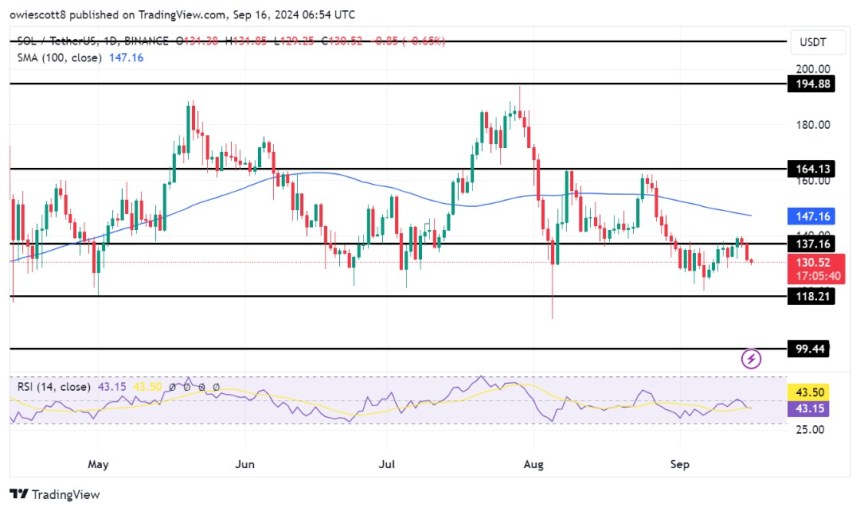
On the daily chart, Solana is exhibiting substantial pessimistic movement, having slipped below the 100-day Simple Moving Average and forming multiple bearish candlesticks as it moves toward the $118 level. This steady decline underscores strong selling pressure and deteriorating market sentiment, signaling a heightened risk of further losses. The persistent downward momentum indicates that bears are firmly in control, with SOL potentially facing even deeper corrections in the near term.
Click Here to Read the Full Original Article at NewsBTC…


