Since the Shiba Inu (SHIB) reached a local high of $0.00001193 on December 16 last year, the price has been in a downtrend characterized by a series of lower highs and lower lows. However, renowned crypto analyst Ali Martinez has now discovered a rare bullish signal that could end this trend.
Shiba Inu Price Flashes Rare Bullish Signal
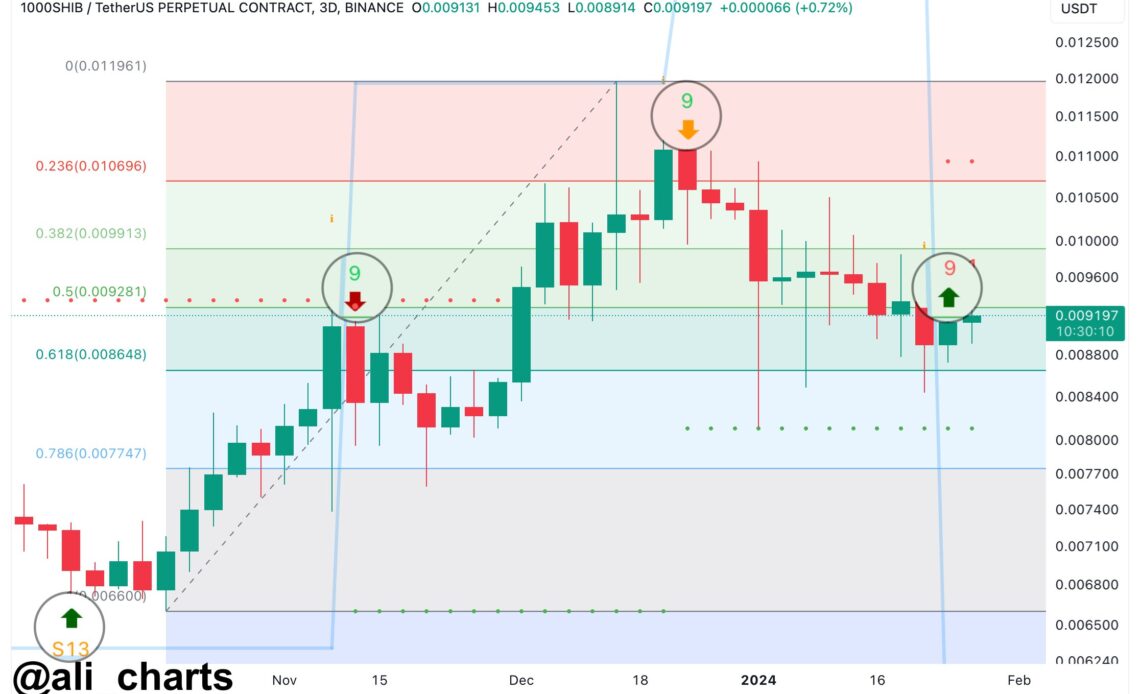
A recent analysis by Martinez (@ali_charts) indicates a potential bullish movement for Shiba Inu (SHIB) based on the TD Sequential indicator. Martinez’s chart, shared via X (formerly Twitter), shows SHIB in a 3-day timeframe against Tether (USDT) on the Binance exchange.
The TD Sequential indicator is a tool used to identify potential price points where an asset’s price is likely to experience an inflection – either a reversal or a continuation of the current trend. On Martinez’s chart, the indicator has presented a “buy signal,” specifically showing a green nine. This suggests the possibility that the current bearish trend could pause, and a bullish trend may ensue.
The chart exhibits a series of green and red candlesticks representing the price movements of SHIB over time. Green candlesticks indicate periods where the closing price was higher than the opening price, while red candlesticks show the opposite. The presence of a green nine suggests that after a succession of price declines over nine periods, the trend may be exhausted, and buyers may soon enter the market.
Martinez points out that the SHIB price is currently hovering around a Fibonacci retracement level of 0.5, at approximately $0.009281. Fibonacci retracement levels are horizontal lines that indicate where possible support and resistance levels might be located.
These are critical because they can indicate areas where the price of an asset may experience pullbacks or continuations. The chart also shows Fibonacci retracement levels at 0.236 ($0.010696), 0.382 ($0.009913), 0.618 ($0.008648), and 0.786 ($0.007747).
The chart analysis by Martinez highlights the potential for SHIB to rise to the $0.010 mark or even extend gains toward $0.011. These price levels are significant as they align with the 0.236 and 0.382 Fibonacci retracement levels, respectively, which may act as resistance points. A breach above these levels could validate the bullish signal provided by the TD Sequential indicator.
Marinez stated, “The TD Sequential indicator has…
Click Here to Read the Full Original Article at NewsBTC…


