In this episode of NewsBTC’s all-new daily technical analysis videos, we are looking at the Bitcoin logarithmic growth curve, the Power Law Corridor, and the 200/100/50-week moving averages.
Take a look at the video below.
VIDEO: Bitcoin Price Analysis (BTCUSD): August 26, 2022
US Fed Reserve Chair Jerome Powell’s speech today is already having an impact on markets, with Bitcoin losing support at $21,000 and in danger of falling deeper into a bear trend. With the crypto market in doubt, in this video we zoomed out.
Log Growth Curve Continues To Support Price Action
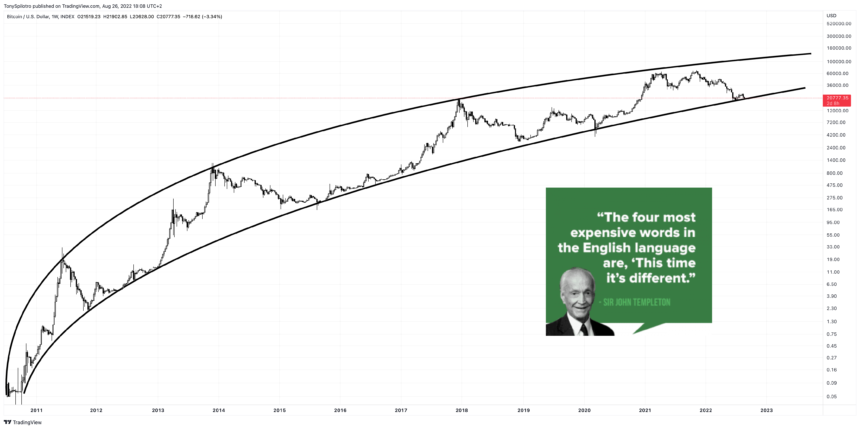
In this zoomed out view we are taking a closer look at the Bitcoin logarithmic growth curve. A logarithmic growth curve increases quickly at the start but gains decrease and become more difficult over time. The log growth curve is closely tied to the law of diminishing returns.
This type of early growth forms naturally. For example, children learn more easily than adults; when dieting, weight comes off faster to start; or in contrast, beginner strength training gains stack up quickly but over time plateau.
The log growth curve has supported the entire history of Bitcoin price action and put a stop to every bull market. On Black Thursday in March 2020 and on August 20 2015 Bitcoin left a wick below the log growth curve. Each time resulted in a powerful bull run. According to legendary investor Sir John Templeton, “The four most dangerous words in investing are, this time its different” Is this time really different?
The log curve has never been broken | Source: BTCUSD on TradingView.com
Power Law Corridor Offers Alternative Take With Lower Support
Some might argue that the log curve is subjective – it is. In the video, we’ve chosen to draw the curve across candle closes allowing a wick below. Slightly adjusting to draw across wicks creates more room at the bottom of the curve.
There is yet another longer-term growth model, called the Bitcoin Power Law Corridor that is less subjective overall. Turning the tool on aligns with both versions of the log curve. The 2018 bear market bottom stopped at the same line we are at now, while the Black Thursday bottom in 2020 fell to the level below.

Bulls could be ready to power-up! | Source: BTCUSD on TradingView.com
A Long-Term Look At The 200/100/50-Week MA
For our final long-term look at Bitcoin, we are analyzing the 200, 100, and 50-week moving averages. Unfortunately,…
Click Here to Read the Full Original Article at NewsBTC…


