The Polygon (MATIC) price has been on a downward spiral for the last couple of weeks. Over the last 24 hours, MATIC lost 4% of its value. The altcoin has also lost about 6% in the last week. Earlier in November, MATIC touched the $1.20 price mark and plunged significantly.
Since the coin plummeted in November, the Polygon price has noted a freefall in its value. Going by the technical outlook on the daily chart, buyers are nowhere to be found. It will be difficult for MATIC to sustain itself above its immediate support level.
The buying strength of Polygon has to increase considerably for it to remain above the local support line. Over the past month, the coin has breached several important price floors. After trading sideways for a while, MATIC lost buyers further, which made the coin fall on its chart again.
For Polygon, the most important price floor currently stands at $0.74. If MATIC loses that support line, the coin can register a significant decline of 14%. The market capitalization of MATIC also declined over the past few weeks, which depicts bearishness for the coin. Currently, the coin is trading 74% below its all-time high secured one year ago.
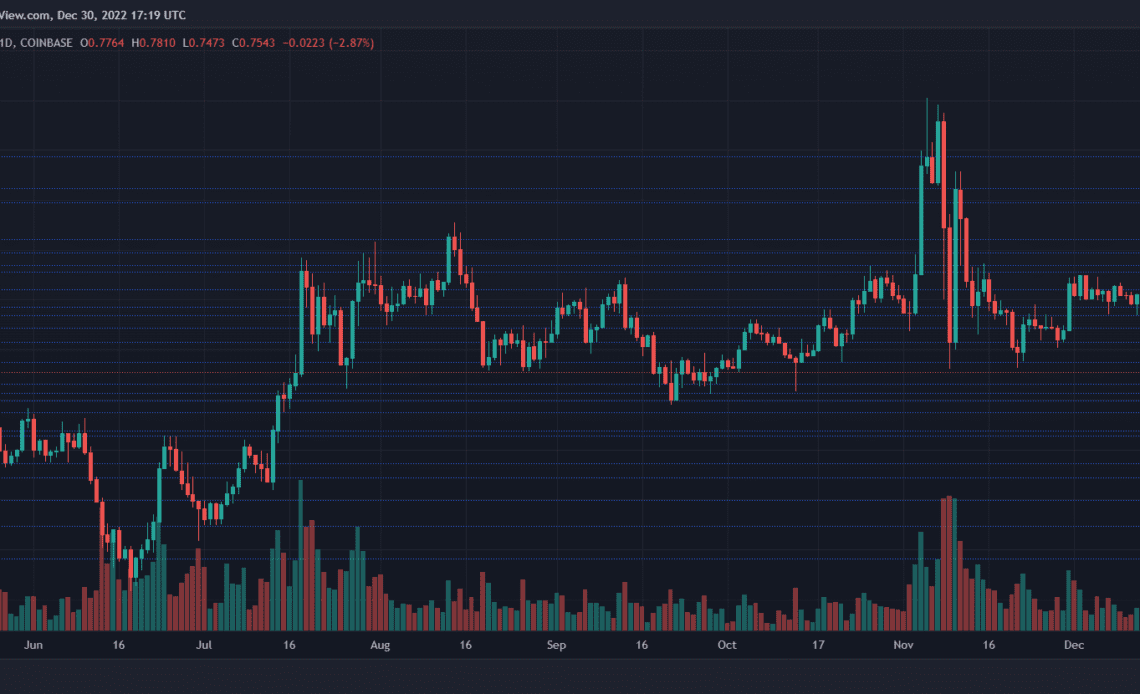
MATIC Price Analysis: One-Day Chart
Polygon was trading at $0.76 at the time of writing. The coin was trading extremely close to the immediate support line of $0.74; one push from the sellers and the price could take another significant bearish turn.
Overhead resistance for MATIC was $0.81; crossing this price level will help the altcoin reach $0.84. The $0.84 level has previously acted as a propelling point for the asset’s price, so this could mean that moving above the $0.84 level would help the coin reverse its price action.
On the other hand, a fall from the present price mark will bring the altcoin to $0.67 and then to $0.63. The amount of Polygon traded in the last session was red, indicating selling dominance.
Technical Analysis
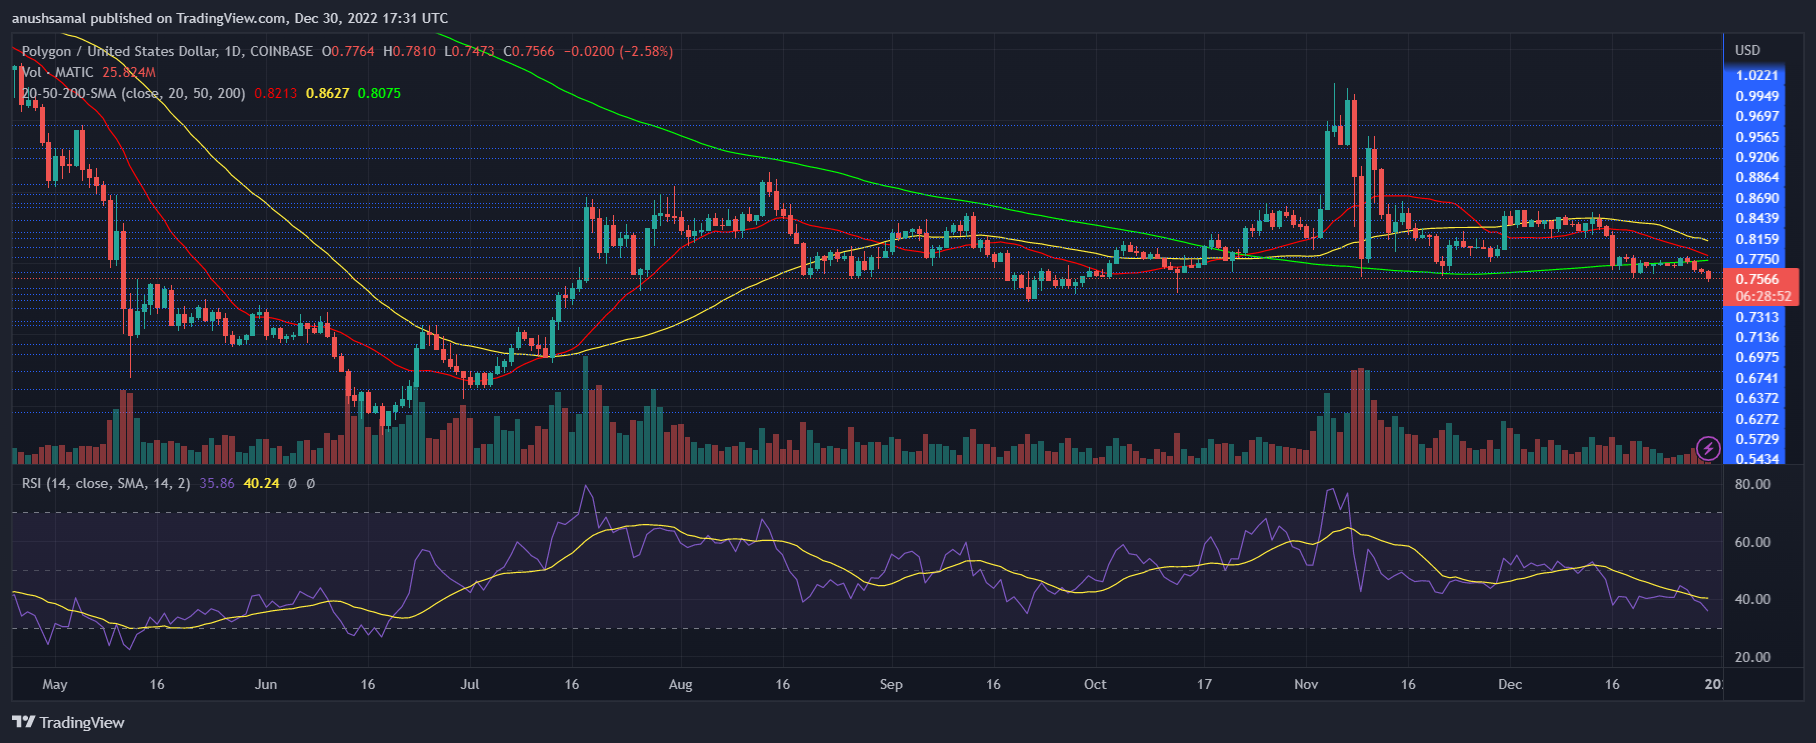
The coin was in the seller’s dominant zone for most of this month. The coin barely recovered after it lost the $0.84 support line. The Relative Strength Index was below the 40-mark, which depicted that the coin received more sellers than buyers.
In correspondence with the same, the coin moved below the 20-Simple Moving Average (SMA) line. This meant that the sellers were driving the price momentum…
Click Here to Read the Full Original Article at NewsBTC…


