A cryptocurrency analyst has explained how Polkadot could potentially see a decline to this level because of a sell signal in in its weekly price chart.
Polkadot Weekly Price Has Formed A TD Sequential Sell Setup Recently
In a new post on X, analyst Ali has pointed out that a TD Sequential sell signal has been forming for Polkadot recently. The “TD Sequential” refers to a tool in technical analysis that’s generally used for pinpointing likely points of reversal in any asset’s price.
The indicator is made up of two phases. In the first phase, called the setup, candles of the same polarity are counted up to 9. After the ninth candle, a probable reversal in the price may be assumed to have taken place.
If the setup’s completion occurred with the overall trend being towards the up (that is, the nine candles were green), the asset might have hit a top. Similarly, a bottom could be in if the price had been going down.
The second phase, known as the “countdown,” begins right after the setup’s completion and lasts for thirteen candles. At the end of these thirteen candles, another probable reversal in the asset could be assumed to have occurred.
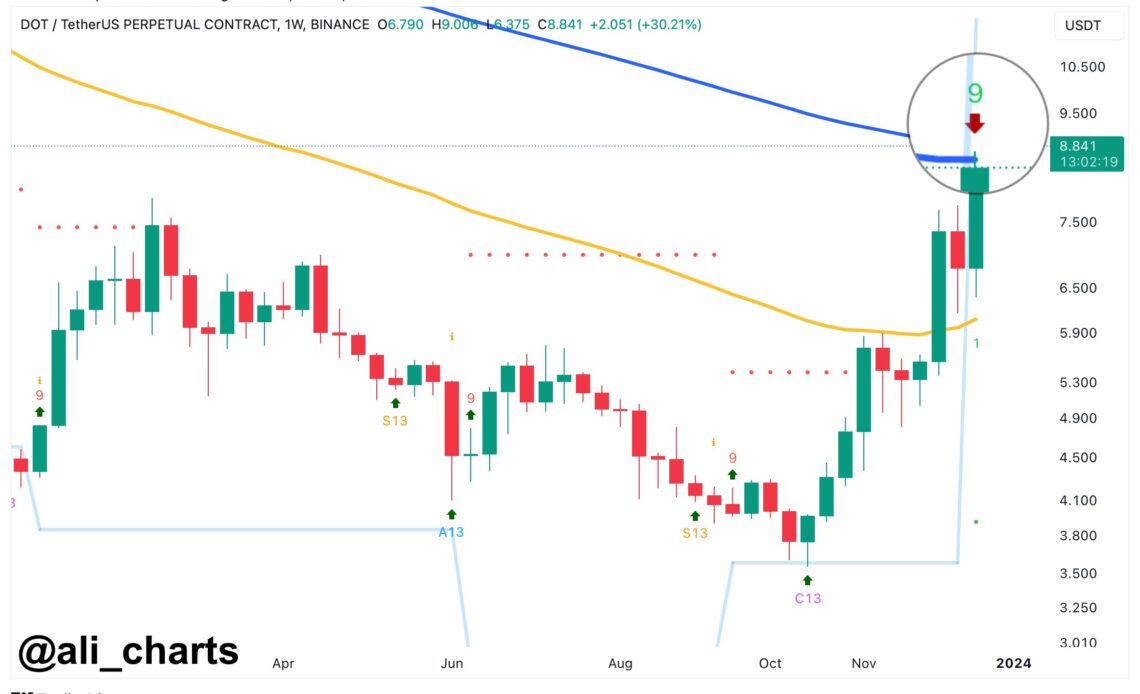
Recently, Polkadot’s weekly price has completed a TD Sequential phase of the former type, as the chart below shared by the analyst shows.
Looks like the cryptocurrency has seen nine green candles in this setup | Source: @ali_charts on X
As is apparent from the graph, the Polkadot weekly price has finished the TD Sequential setup phase with green candles recently. This could suggest that a sell signal has now formed for the cryptocurrency.
In the same chart, Ali has also displayed the data for the 100-day exponential moving average (EMA) for the asset, a level that has been a source of resistance in the past.
Interestingly, this TD Sequential setup has completed just as the weekly price of the cryptocurrency has approached the 100-day EMA. “This could lead to a spike in profit-taking, potentially driving DOT down to $7.50,” explains the analyst. From the current spot price, a drawdown to this level would mean a drop of more than 18% for Polkadot.
DOT Is Up Almost 3% During The Last 24 Hours
While these bearish developments have occurred in the weekly price of DOT, the asset has still continued to rise during the past day, as its price has now cleared the $9.2 level.
Below is a chart that shows how Polkadot has performed during the past month.

The price of the asset...
Click Here to Read the Full Original Article at NewsBTC…


