Polkadot (DOT) has been gaining significant bullish momentum, with its price steadily approaching the critical resistance level of $4.8. This upward movement suggests a strong presence of positive sentiment in the market. As DOT nears this key resistance, speculations are about whether the bulls can maintain their dominance and drive the price higher. A successful breakout above $4.8 could signal the beginning of a new bullish phase, potentially leading to further gains. However, failure to break this level might result in a pullback.
This article analyzes DOT’s recent price action and its approach to the critical $4.8 resistance level. With the help of technical indicators, it will evaluate the significance of this resistance, assess market sentiment, and predict potential future movements, including the likelihood of a breakout.
DOT was trading at around $4.73 and has increased by over 3.58% with a market capitalization of over $6.9 billion and a trading volume of over $200 Million as of the time of writing. In the last 24 hours, the asset’s market cap has increased by more than 3.61%, while its trading volume has increased by more than 7.46%
Market Sentiment: Are Bulls In Control?
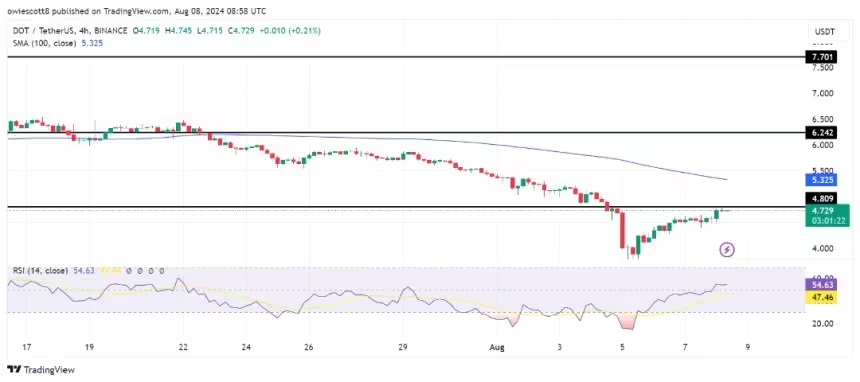
Currently, the price of DOT on the 4-hour chart has been on a bullish move following a rejection at the $3.5 support mark. It is now advancing toward the $4.8 resistance mark and the 100-day Simple Moving Average (SMA). Since breaching this key resistance level, the digital asset has shown a consistent upward trend, indicating that the bulls are gaining control and could drive the price even higher.
Additionally, an analysis of the 4-hour Relative Strength Index (RSI) shows that the signal line of the indicator has successfully risen above 50% and is currently heading to 60%, suggesting that buying pressure is increasing and the asset might experience further upward movement.
On the 1-day chart, although DOT is still trading below the 100-day SMA, it has successfully printed three bullish momentum candlesticks approaching the $4.8 resistance level. This indicates that the bulls remain in control, which could help trigger a rally for DOT.
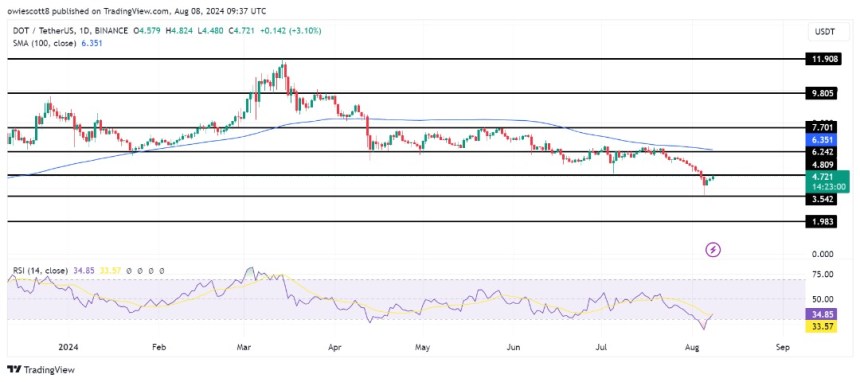
Finally, on the 1-day chart, the RSI signal line is ascending from the oversold zone toward 50%, further supporting the potential for a continued rally and indicating…
Click Here to Read the Full Original Article at NewsBTC…


