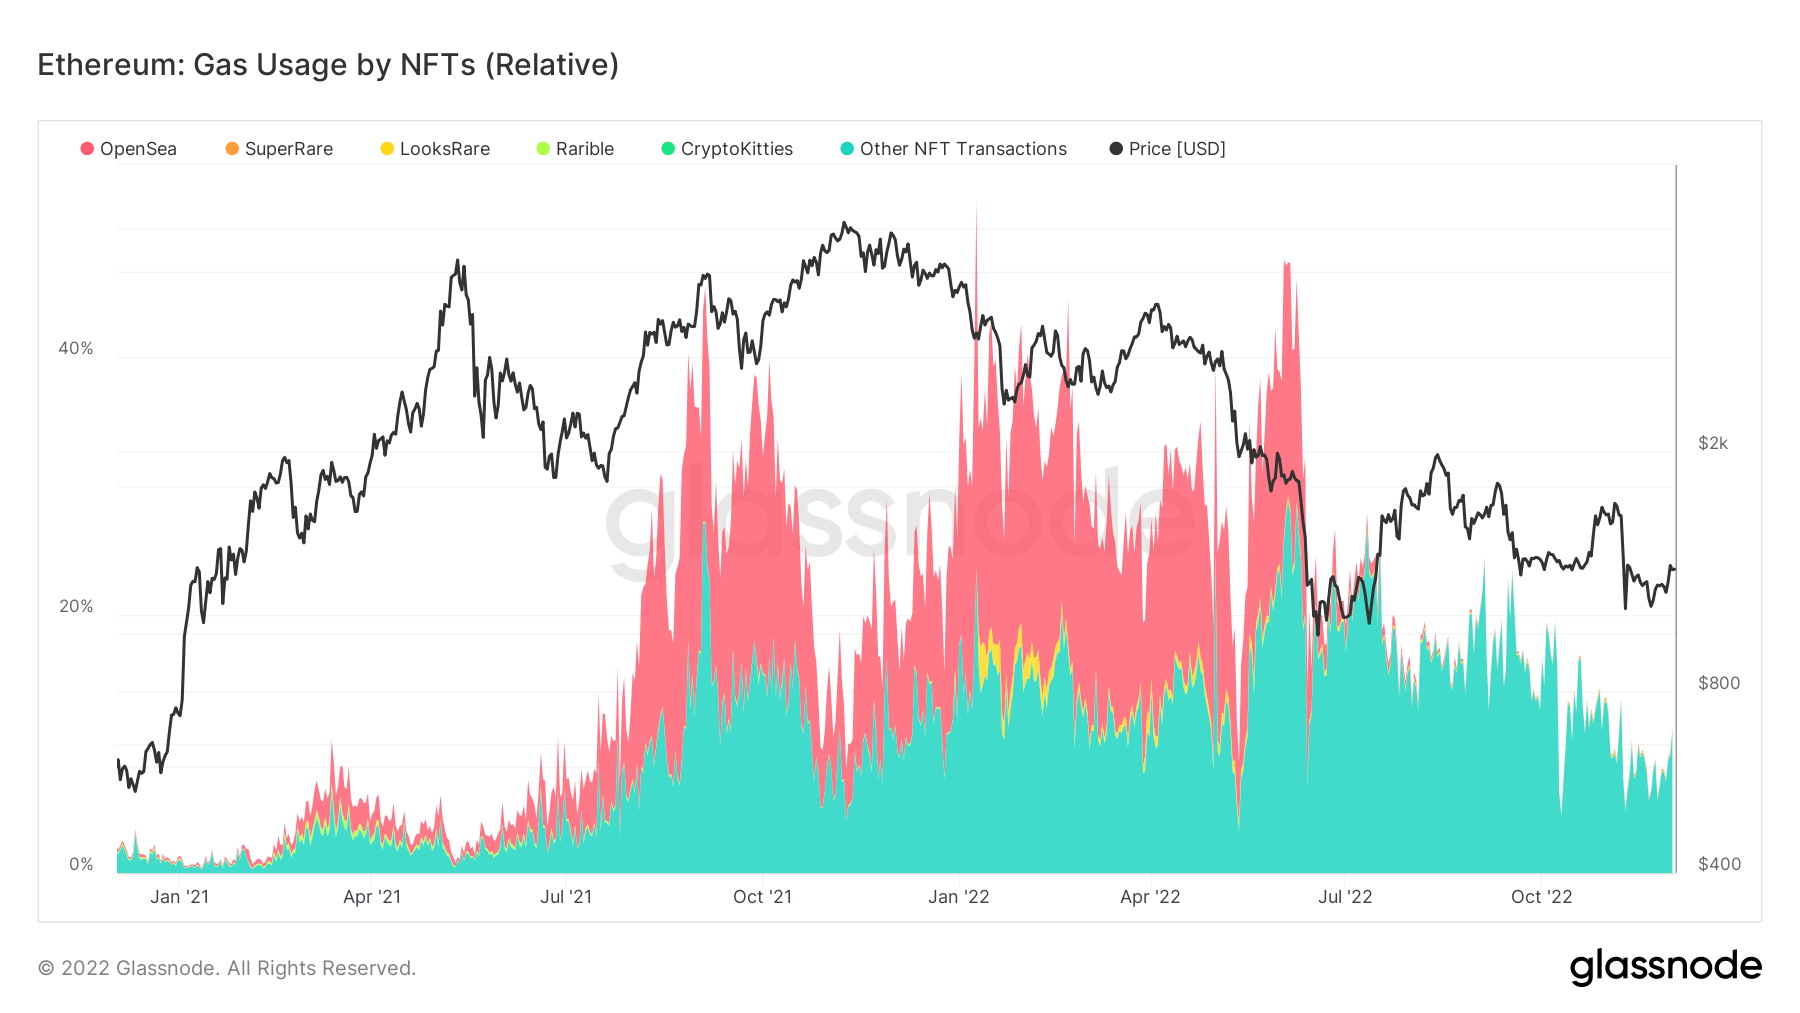
CryptoSlate’s analysis of gas consumption on the Ethereum (ETH) network based on transactions interacting with non-fungible tokens contracts showed that OpenSea’s gas usage has declined to almost zero.
The analysis included token contract standards (ERC721 and ERC1155) and other NFT marketplaces like LooksRare, Rarible, and SuperRare.

According to the above chart, overall gas fees in transactions related to NFTs peaked between October 2021 and January 2022. During this period, OpenSea accounted for roughly 20% of NFT gas consumption on Ethereum.
The largest NFT marketplace was still able to maintain its dominance in gas consumption until July, when it began to decline rapidly –this coincided with when the bear market was negatively impacting NFT sales.
OpenSea’s Ethereum NFTs trading volume has declined for five consecutive months, according to dune analytics data.
Layer2 networks’ gas consumption crosses $100 billion
Meanwhile, Ethereum layer2 networks spent over $100 billion in gas fees to validate transactions and operate their bridges on the mainnet in November, according to data shared by Paolo Rebuffo.
In November 2022 for the first time, L2 systems consumed more than 100b gas to validate transactions and operate their bridges on L1. 6 months ago in May 2022 the 50b gas threshold was exceeded for the first time.
A doubling time of the gas consumed by the l2 systems of 6 months. pic.twitter.com/hgUmKrx9pl— funnyking.eth zkHODLER 🦦🐛🦈 (@PaoloRebuffo) November 28, 2022
This represented an over 100% growth from the start of the year when the gas fees was $33.2 billion.
According to the data, Optimism was responsible for almost 50% of the gas fees, while Arbitrum took 30% of the fees. Other networks like dYdX, Loopring, and Starkware accounted for the rest.
Click Here to Read the Full Original Article at Ethereum (ETH) News | CryptoSlate…


