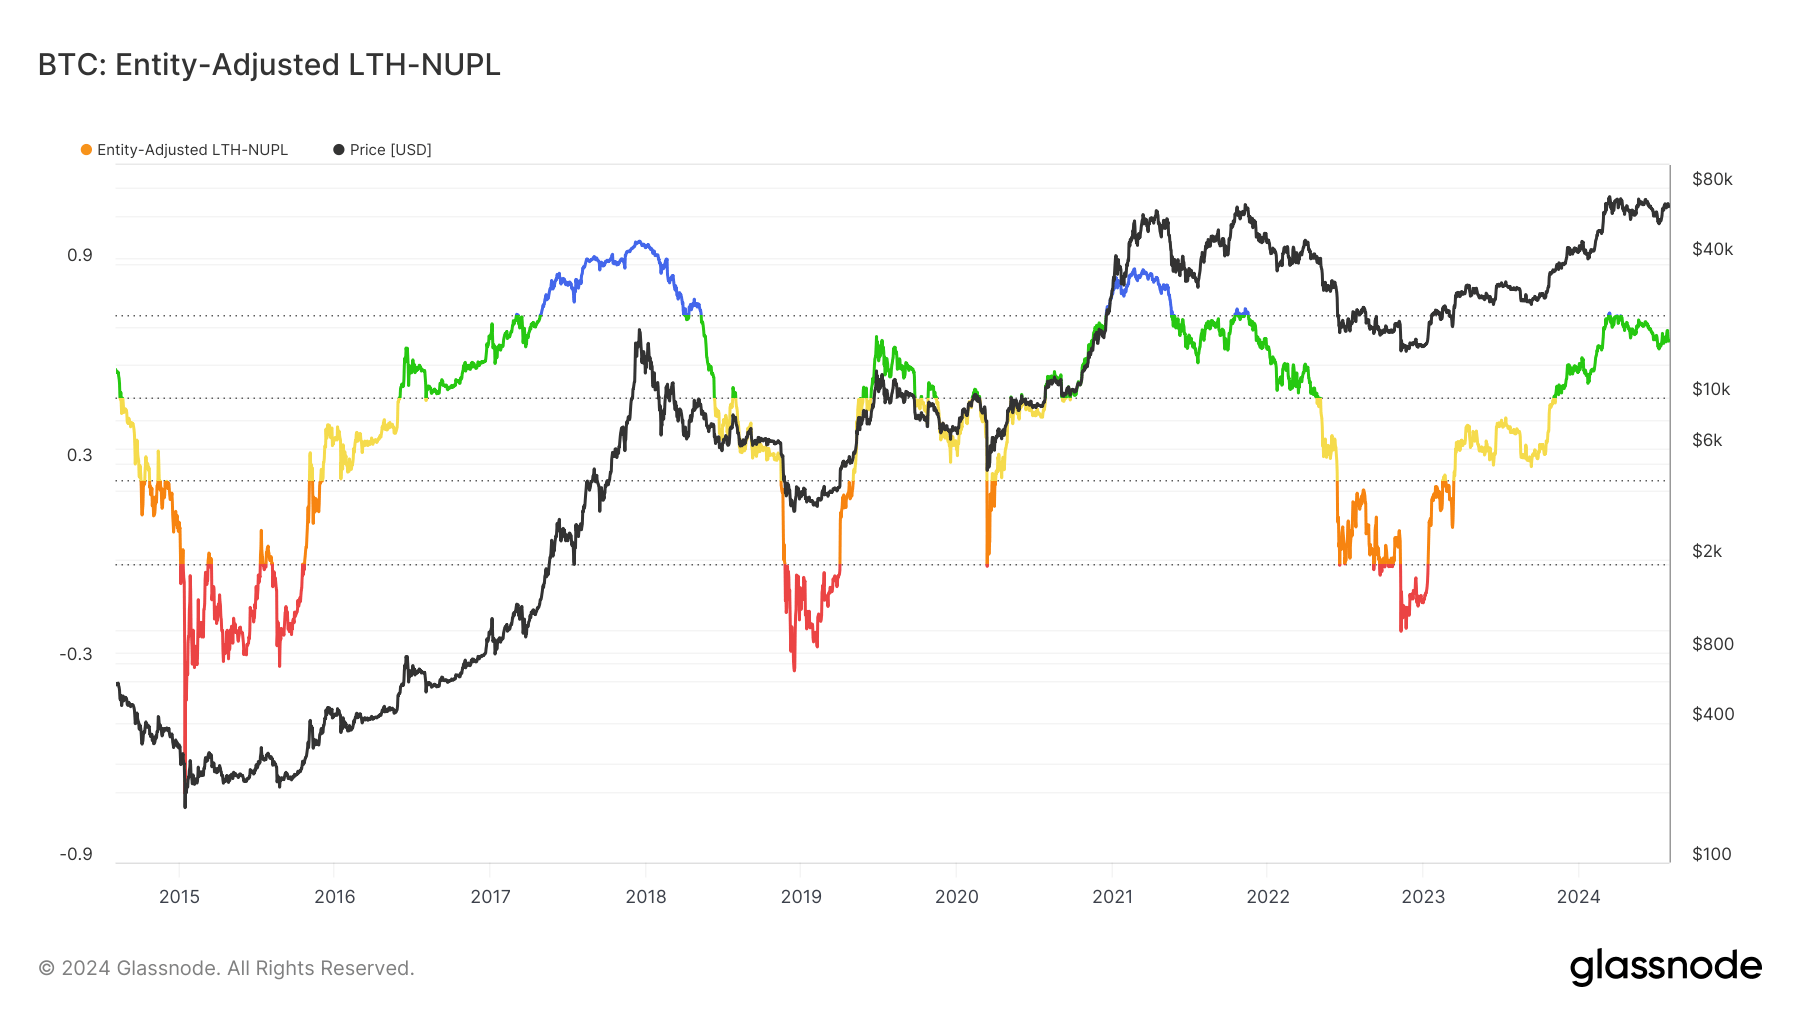
Entity-adjusted Bitcoin metrics provide a refined view of market sentiment by filtering out non-economic transactions. This is especially important when analyzing net unrealized profit and loss, such as the LTH-NUPL and STH-NUPL.
Non-entity-adjusted metrics can show skewed, unclear, or incorrect data because they include all transactions, even internal transfers within the same entity. These “in-house” transactions do not represent real economic activity but can artificially inflate or deflate the apparent level of unrealized profit or loss.
For instance, large internal transfers might create the illusion of increased market activity or profit-taking, resulting in false interpretations of market tops or bottoms and ultimately causing inaccurate market predictions.
Entity-adjusted LTH-NUPL is an advanced metric that considers the actual economic activity of long-term holders by excluding these “in-house” transactions. This helps filter out activity from large institutional players that have become ubiquitous in the industry since the launch of spot Bitcoin ETFs.
Historically, LTH-NUPL has been a reliable indicator of market sentiment, particularly in identifying market tops and bottoms. When the LTH-NUPL crosses above 0.7, it typically signals the beginning of a euphoria or greed phase in the market. This phase often correlates with market tops as long-term holders realize significant unrealized profits. Conversely, values between 0.5 and 0.7 indicate a belief or denial phase, depending on the price direction.
In 2024, LTH-NUPL has consistently remained above 0.5, suggesting a strong belief in the market’s upward trend among long-term holders. The metric briefly crossed into the greed phase from May 11 to May 13, showing a short-lived euphoria as Bitcoin reached its new all-time high.
Since July, LTH-NUPL has been trending upwards with significant volatility, reaching 0.70 on July 27 before slightly decreasing to 0.66 by July 31.
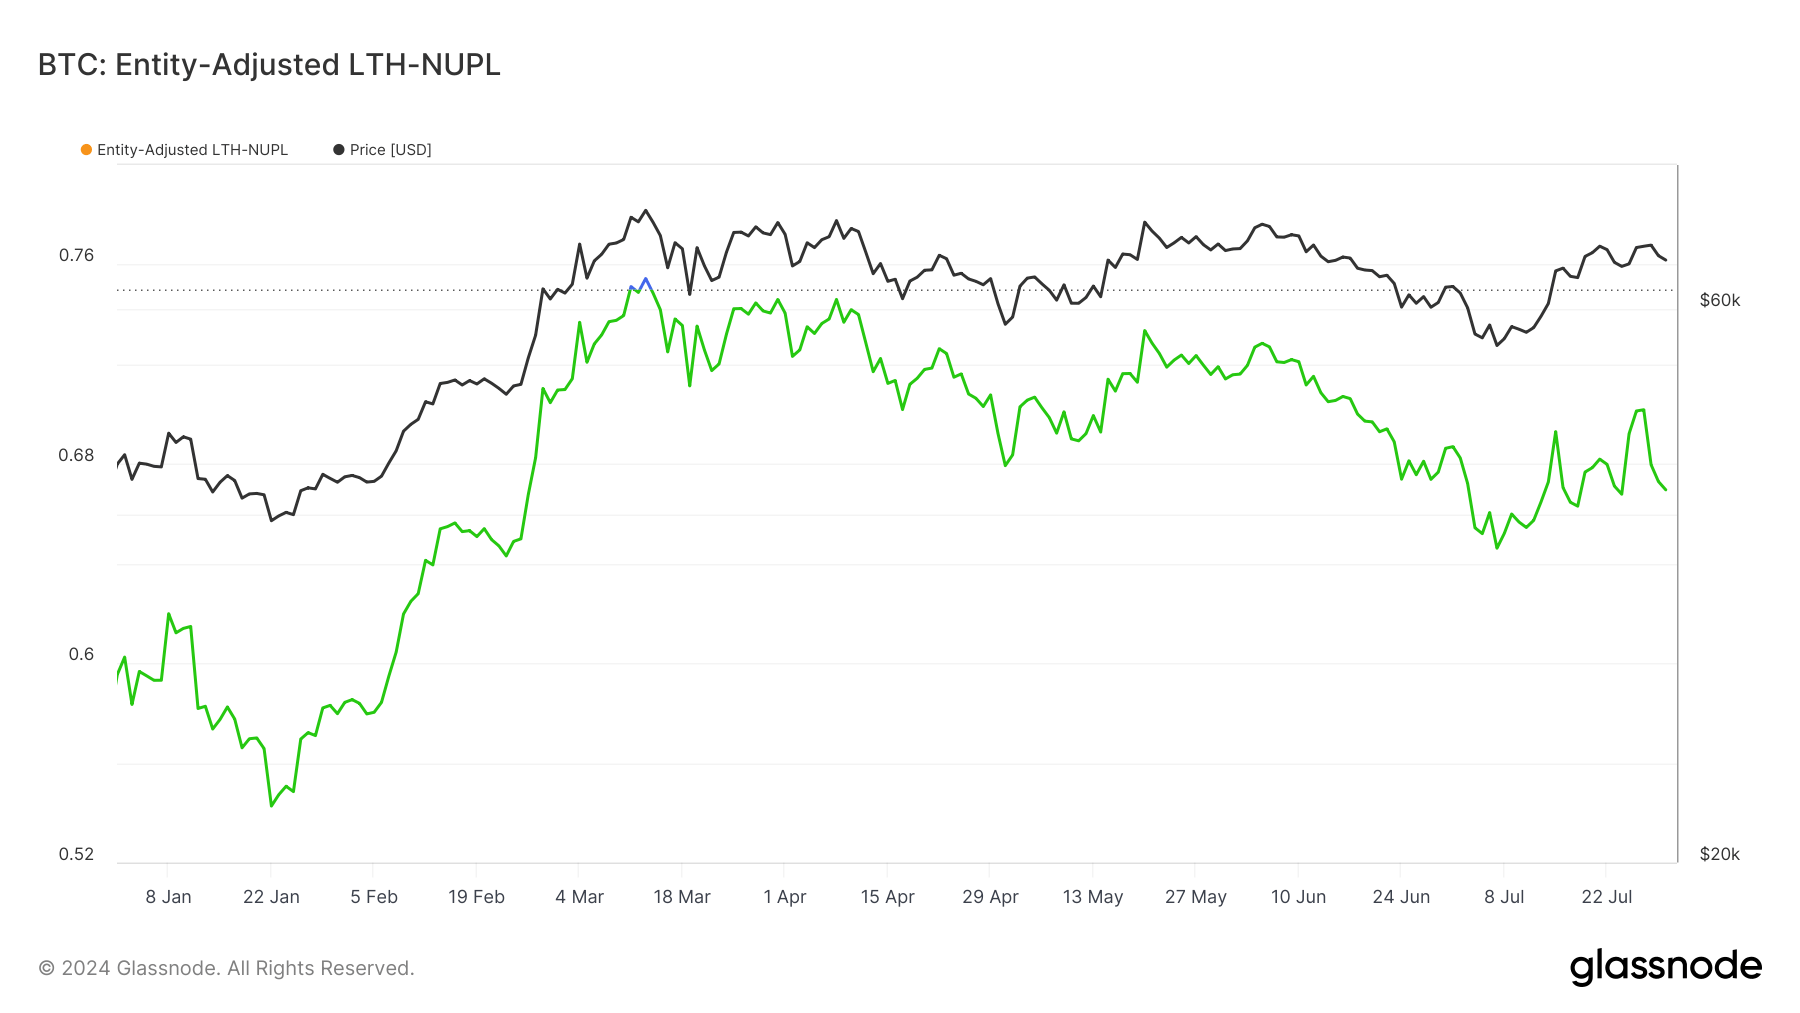
This upward trend in LTH-NUPL reflects the confidence of long-term holders in the ongoing market rally despite the occasional volatility. The metric’s resilience above 0.5 throughout the year shows the cohort’s sustained belief.
Entity-adjusted STH-NUPL, on the other hand, measures the net unrealized profit or loss of short-term…
Click Here to Read the Full Original Article at Bitcoin (BTC) News | CryptoSlate…


