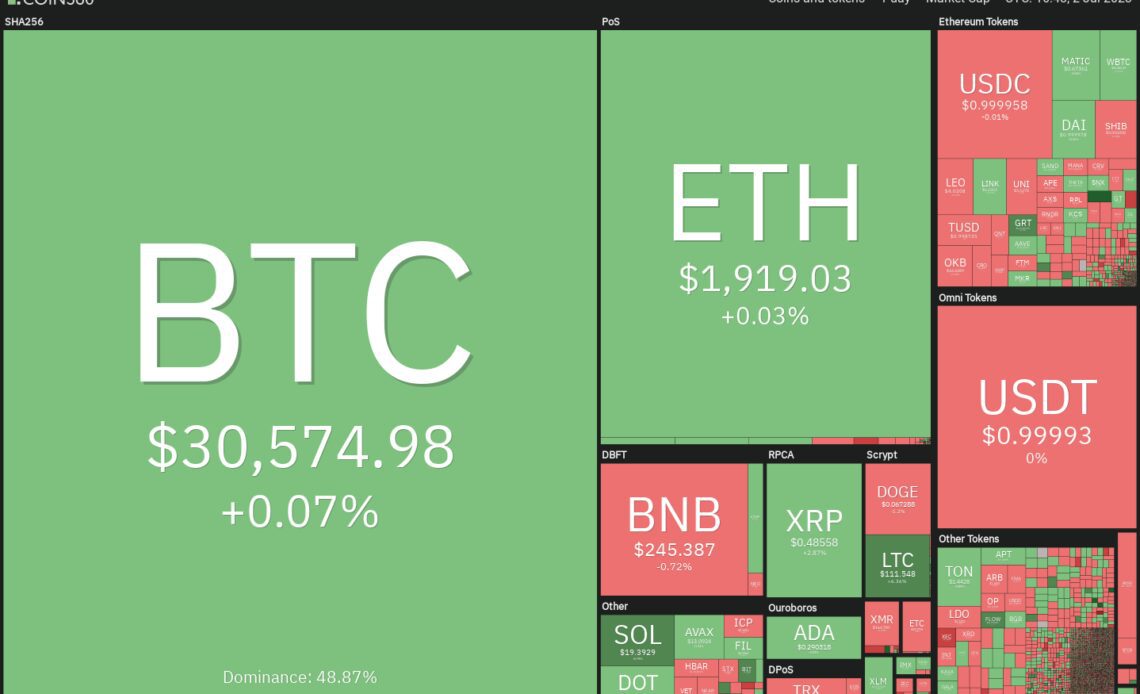
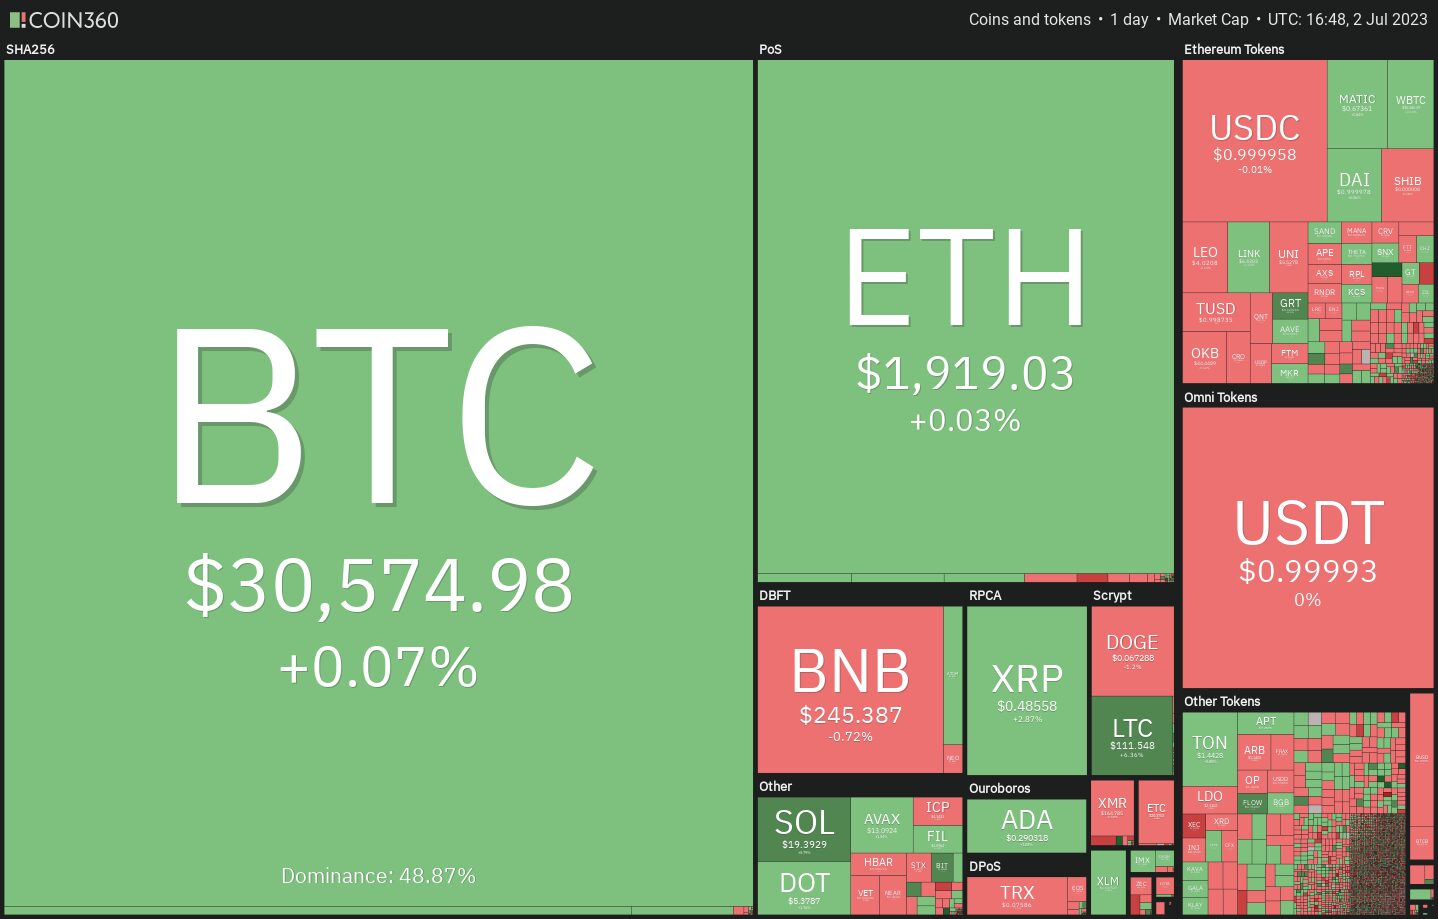
Bitcoin (BTC) has been trading in a narrow range for the past few days, but that doesn’t take away the sheen from its stunning 84% rally in 2023. The strong recovery in Bitcoin’s price has boosted buying in several altcoins, which have risen sharply from their yearly lows.
As the second half of the year begins, the central question on every investor’s mind is: Will the rally continue? CoinGlass data shows that July has seen only three negative monthly closes since 2013, with the most significant decline being 9.69% in 2014. This suggests that bulls have a slight edge.
A large part of the latest leg of the rally in Bitcoin and altcoins was fuelled by hopes that the United States Securities and Exchange Commission will approve one or more applications for a spot Bitcoin exchange-traded fund. Any adverse news on this front could turn the sentiment bearish and result in a sharp sell-off.
However, for now, Bitcoin and select altcoins are showing strength. Let’s analyze the charts of the top five cryptocurrencies that may continue their up-move over the next few days.
Bitcoin price analysis
Bitcoin (BTC) continues to trade near the stiff overhead resistance at $31,000. This suggests that the bulls are in no hurry to book profits, as they anticipate another leg higher.
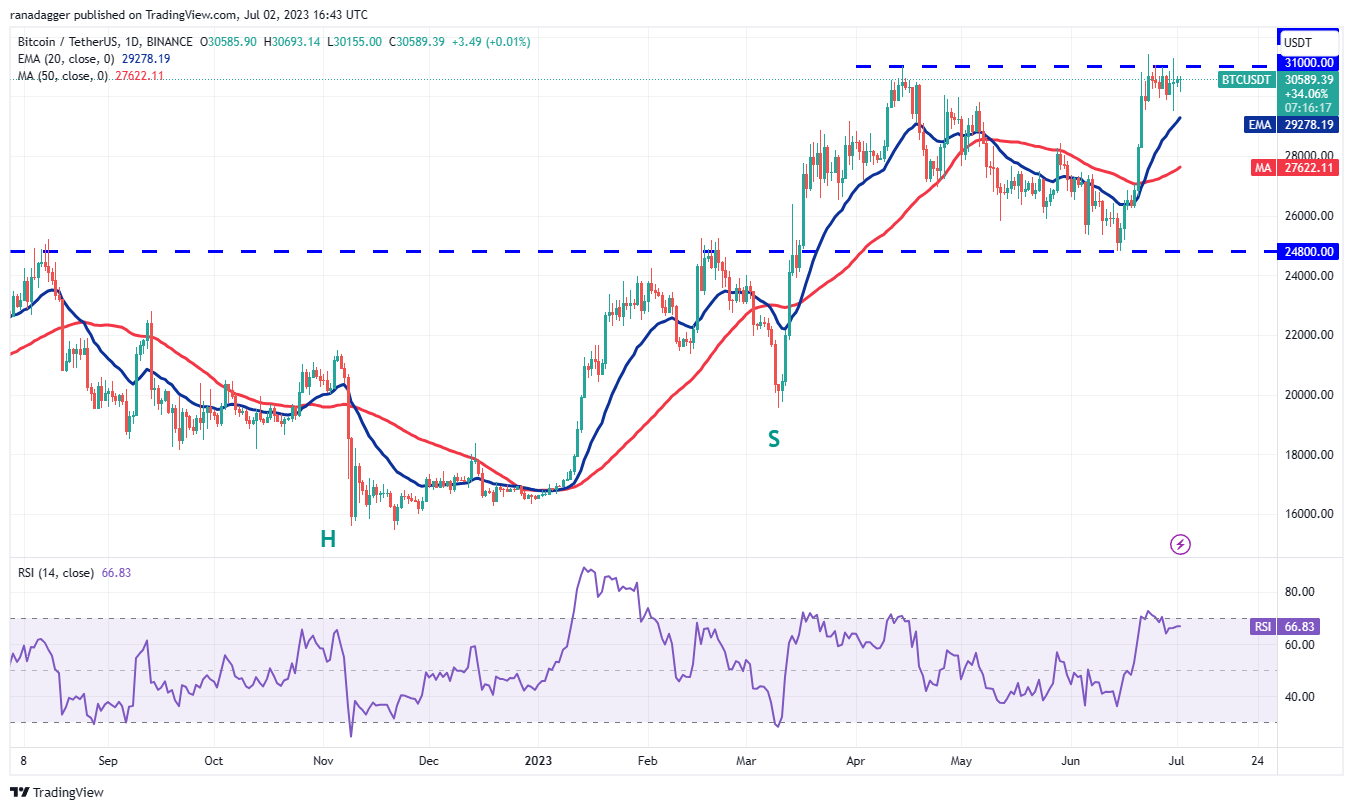
Usually, a tight consolidation near a crucial overhead resistance resolves to the upside. The rising 20-day exponential moving average (EMA) ($29,278) and the relative strength index (RSI) in the positive territory indicate that the road of least resistance is to the upside.
If bulls propel and sustain the price above $31,000, the BTC/USDT pair is likely to start the next leg of the uptrend. The bullish momentum may catapult the price above the immediate resistance at $32,400. If that happens, the pair may continue its northward march toward $40,000.
If bears want to make a comeback, they will have to sink and sustain the price below the 20-day EMA. The pair could then slide to the 50-day simple moving average (SMA) ($27,622).
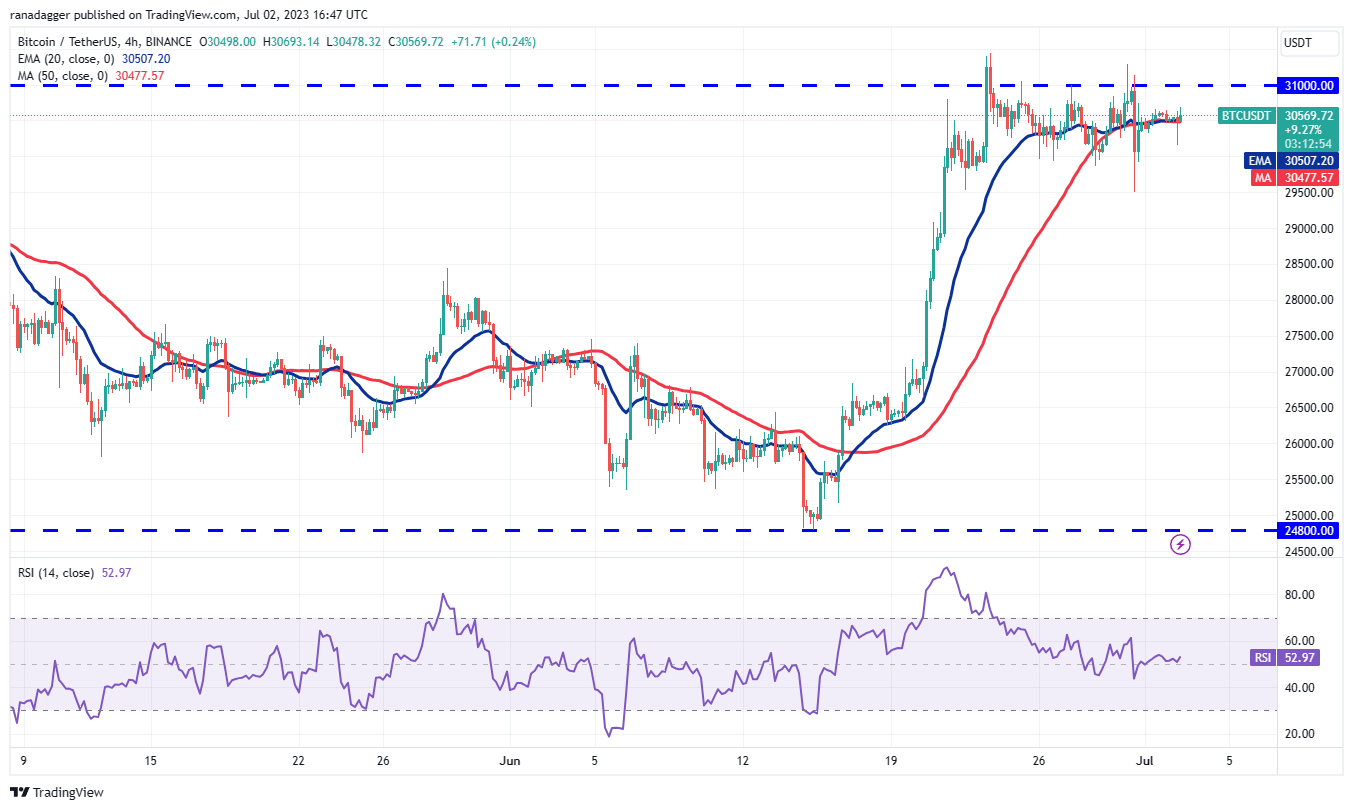
Both moving averages have flattened out and the RSI is near the midpoint, indicating a balance between supply and demand. The price has been stuck between $31,431 and $29,500 for some time.
Buyers will have to drive and sustain the price above the $31,431 hurdle to indicate the resumption of the up-move. Alternatively, a break and close below…
Click Here to Read the Full Original Article at Cointelegraph.com News…


