Among the 20 most important cryptocurrencies by market capitalization, Chainlink (LINK) is currently recording the second-highest loss of -10.4 % in the last seven days. This puts it just behind Ethereum, which recorded a slightly sharper decline of -10.9 %.
Despite this, a glimmer of optimism emerges when delving into the 1-day chart of LINK/USD. The analysis suggests a potential turnaround on the horizon. Should the current market structure remain intact, there’s a promising indication that the recent corrective phase for LINK might be drawing to a close.
Chainlink Price Analysis: Indicators To Watch
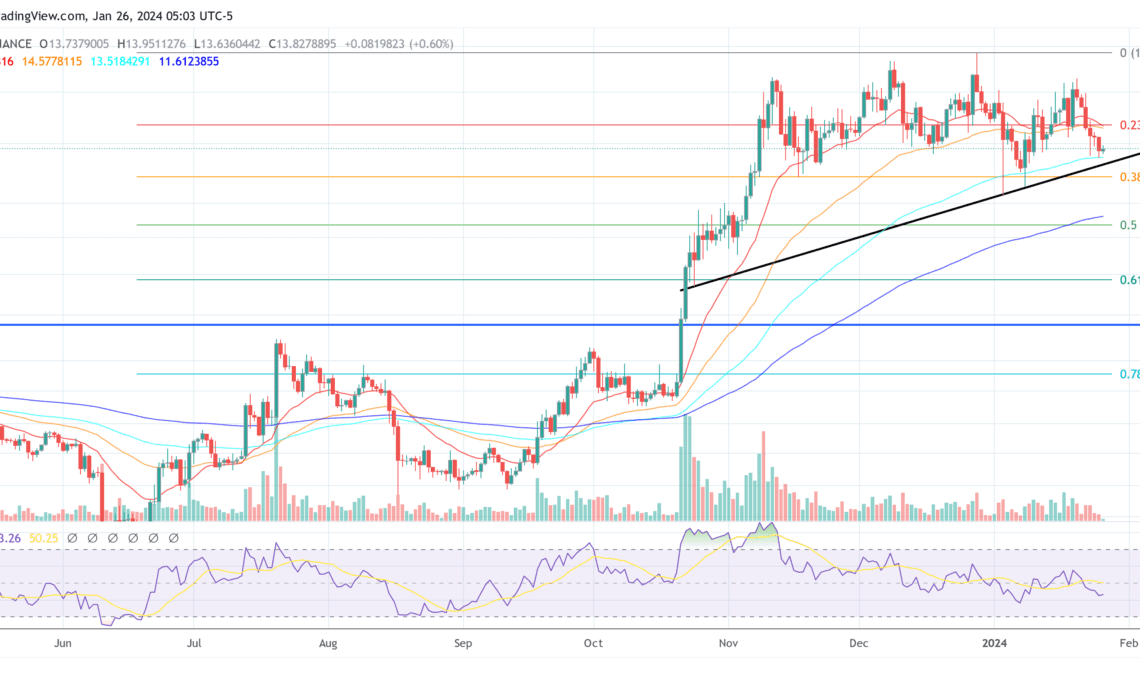
Several key indicators and patterns emerge that warrant the attention of traders and investors alike. Firstly, the price action has been demonstrating a series of higher lows, which could be indicative of an ascending triangle pattern forming – a bullish continuation pattern. As long as the LINK price holds above the rising trend (black line) established in late October of the previous year, the bulls remain in control.
At press time, LINK was trading at $13.82, presenting a nuanced narrative in its Exponential Moving Average (EMA) positioning. A critical observation is that LINK’s price is buoyantly positioned above the longer-term 100-day and 200-day EMAs, recorded at $14.6679316 and $11.61, respectively. This configuration typically signals a robust long-term bullish momentum, underpinning investor confidence in the asset.
Contrastingly, the short-term outlook is conveyed by the positioning of the 20-day and 50-day EMAs. With the 20-day EMA at $14.67 and the 50-day EMA at $14.58, both hover above the current price level, imparting a potential resistance zone. This immediate overhead resistance is indicative of a short-term bearish pressure or consolidation phase, possibly reflecting a market pause as traders and investors reassess their positions.
The Fibonacci retracement levels, drawn from the swing low in June to the peak in December, suggest that LINK has recently tested the 0.236 retracement level at $14.70 as resistance. The subsequent levels to watch are 0.382 at $12.85, followed by 0.5 at $11.53, which could serve as potential support levels if a bearish reversal occurs. Conversely, a break above the 0.236 level may open the door to test the $17.69 level, which stands as a significant resistance.
On the volume front, trading activity has…
Click Here to Read the Full Original Article at NewsBTC…


