SUI is experiencing a notable pullback after its recent rally, with multiple key support levels coming into focus. As the price edges lower, these areas will play a pivotal role in determining whether the asset can regain its bullish momentum. A strong defense of these supports could signal the start of a fresh upward move, while a failure to hold may lead to deeper declines.
This article aims to assess SUI’s recent price pullback and explore critical support levels that could trigger a potential bullish reversal. By analyzing technical indicators and market conditions, it seeks to provide insights into possible recovery scenarios, highlighting the levels to watch for a sustained upward movement or further downside risk.
Recent Price Action: SUI’s Decline Explained
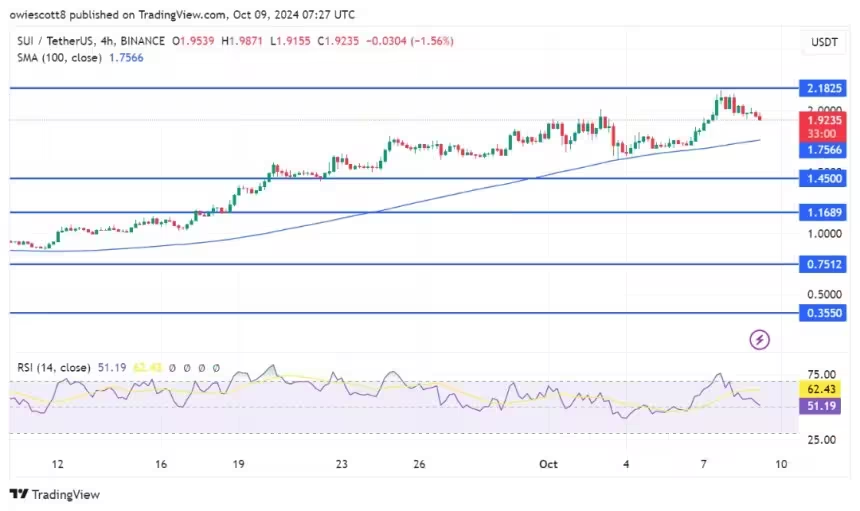
Recently, SUI’s price has taken a bearish turn on the 4-hour chart, following a rejection at the $2.1 resistance level. Despite this decline, the cryptocurrency remains above the 100-day Simple Moving Average (SMA), indicating that a recovery may be possible, provided buyers regain control and the market shifts back in favor of the bulls.
An analysis of the 4-hour Relative Strength Index (RSI) suggests that bulls could be preparing for a resurgence. Although the RSI has slipped to 55% from the overbought zone, it remains above the crucial 50% mark, indicating that bullish momentum persists. This positioning reflects a temporary slowdown, but as long as the RSI holds above this threshold, the market retains the potential for renewed upward movement.
Related Reading
Also, on the daily chart, SUI is exhibiting signs of negative pressure, trading above the 100-day SMA. While the price remains above the SMA, this current bearish movement could be short-lived, as there remains a possibility for a price recovery. The positioning above the SMA implies that buyers could step in to reverse the trend if they regain control, potentially leading to a rebound in price.
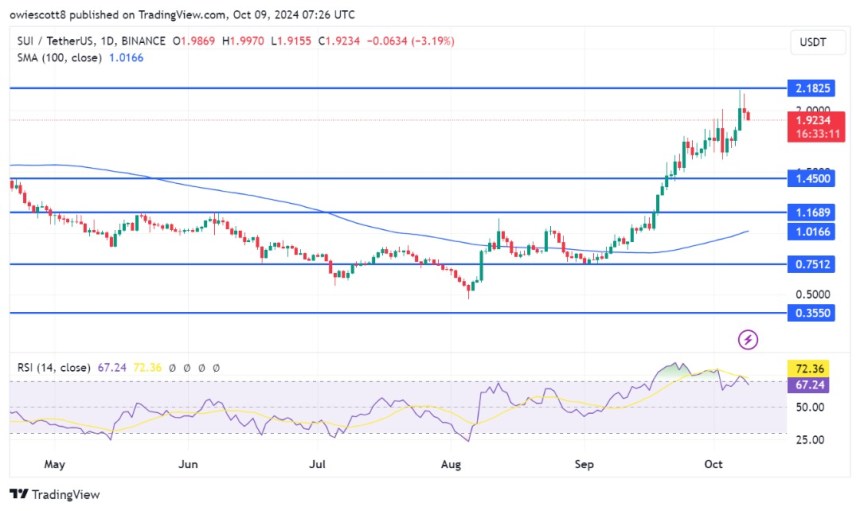
Finally, on the 1-day chart, a closer examination of the RSI formation indicates that SUI’s price may experience further declines, as the signal line has descended to 69% from the overbought territory. However, there is the possibility of a bullish comeback if the RSI can…
Click Here to Read the Full Original Article at NewsBTC…


