Despite a strong bullish run in recent months, Helium (HNT) was unable to hold its ground against tether (USDT), with the price falling from an all-time high of $50 to around $5. The recent price increase in Bitcoin (BTC) has had a positive impact on the overall market, as most altcoins continue to show strength, producing more than 100% gains, with Helium (HNT) price also in the picture due to its impressive recovery. (Data from Binance)
Helium (HNT) Price Analysis On The Weekly Chart
The price of HNT has struggled to replicate its recent bullish move, which saw the price rally to $50 with a strong bullish sentiment.
After falling from a high of $50 to a low of $4, HNT has struggled to stay afloat. HNT has formed strong support at $4, which appears to be a good area for most traders to place buy orders.
HNT’s price could end the week on a more bullish note ahead of a new weekly candle. With such strong sentiment, HNT could reach a high of $8 and possibly $12.
The price of HNT is facing resistance at $6.5 as it cannot trend higher in price; if HNT flips this region, we could see the price rising to $8-$10 and even higher.
Weekly resistance for the price of HNT – $6.5.
Weekly support for the price of KNC – $4.5.
Price Analysis Of HNT On The Daily (1D) Chart
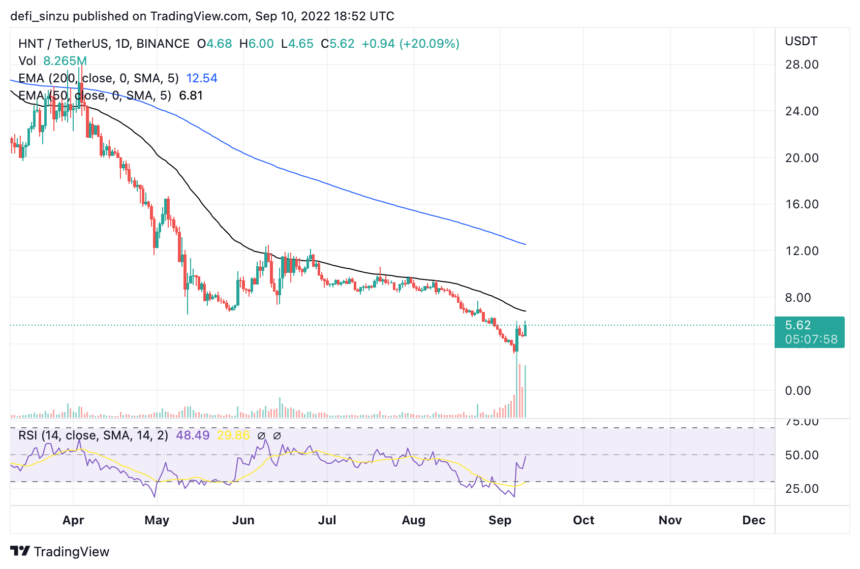
The price of HNT was rejected from $25 as it fell to a low of $4; the price of HNT bounced from this after forming support to withstand sell orders.
HNT rose from a low of $4 to $5.7 before hitting resistance in its attempt to break above $6.5.
HNT is trading at $5.7 on the daily timeframe, attempting to break and hold above the 50 Exponential Moving Averages (EMA). The $7 price corresponds to the 50 EMA, which acts as a price barrier for HNT.
HNT must break above $7, which serves as resistance for the price of HNT. If HNT breaks and closes above this level, the price could rise to $10-$12.
Daily resistance for the HNT price – $7.
Daily support for the HNT price – $4.5.
HNT Price Analysis On The Four-Hourly (4H) Chart

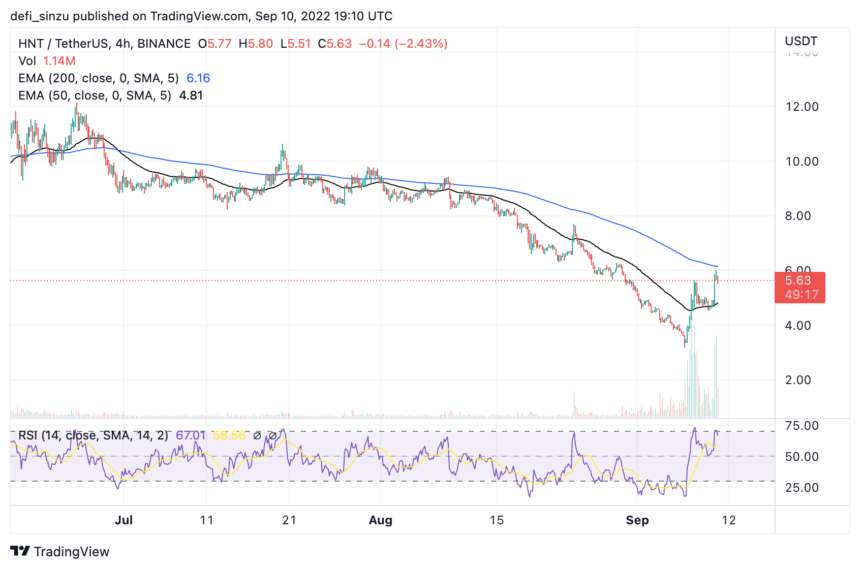
After breaking out of its long downtrend, HNT’s price in the 4H timeframe remains bullish. HNT is trading above the 50 but below the 200 EMAs; a break and hold above the 200 EMA to form support would indicate bullish price action for HNT.
Prices at the 50 and 200 EMAs are $4.7 and $6.2, respectively.
On the 4H chart, the…
Click Here to Read the Full Original Article at NewsBTC…


